SECURITIES AND EXCHANGE COMMISSION
(Rule 14a-101)
INFORMATION REQUIRED IN PROXY STATEMENT
SCHEDULE 14A INFORMATION
the
Securities Exchange Act of 1934
(Amendment No. )
|
|
|
|
|
Not applicable.
![[MISSING IMAGE: cv_ofcannualmeeting-pn.jpg]](https://capedge.com/proxy/DEF 14A/0001104659-24-041966/cv_ofcannualmeeting-pn.jpg)
| | ![[MISSING IMAGE: lg_nextera-pn.jpg]](https://capedge.com/proxy/DEF 14A/0001104659-24-041966/lg_nextera-pn.jpg) | | | |
NextEra Energy, Inc. 700 Universe Boulevard Juno Beach, Florida 33408-0420 | ||||

Notice of 2022
Annual Meeting and
Proxy Statement
YOUR VOTE IS IMPORTANT
PLEASE SUBMIT YOUR PROXY PROMPTLY
NextEra Energy, Inc.
700 Universe Boulevard
Juno Beach, Florida 33408-0420
Notice of Annual Meeting of Shareholders
May 19, 2022
| | MEETING AGENDA | | | BOARD RECOMMENDATION | | ||||||
| | 1. | | | Election as directors of the nominees specified in the accompanying proxy | | | | | FOR each nominee | | |
| | 2. | | | Ratification of appointment of Deloitte & Touche LLP as NextEra Energy’s independent registered public accounting firm for | | | | | FOR | |
| | 3. | | | Approval, by non-binding advisory vote, of NextEra Energy’s compensation of its named executive officers as disclosed in the accompanying proxy | | | | | FOR | |
| | 4. |
| | A shareholder | | | | | AGAINST | |
| | 5. | | | A shareholder proposal entitled “Climate Lobbying Report” requesting a report on the Company’s lobbying and trade association memberships in relation to the Company’s emissions goal | | | | | AGAINST | | |
| | 6. | | | Such other business as may properly be brought before the annual meeting or any adjournment(s) or postponement(s) of the annual | | | | | | ||
26, 2024.
Regardless of whether
YOUR PROXY OR VOTING INSTRUCTIONS PROMPTLY SO THAT YOUR SHARES CAN BE VOTED.
| | | | | By order of the Board of Directors, W. SCOTT SEELEY Vice President, Compliance & Corporate Secretary Juno Beach, Florida April 1, 2024 | |
| | | IMPORTANT NOTICE REGARDING THE AVAILABILITY OF PROXY MATERIALS FOR THE ANNUAL MEETING TO BE HELD MAY 23, 2024 This proxy statement and the NextEra Energy 2023 annual report to shareholders are available at www.proxyvote.com. | | |
![[MISSING IMAGE: tm2228016d1-pht_matric4c.jpg]](https://capedge.com/proxy/DEF 14A/0001104659-24-041966/tm2228016d1-pht_matric4c.jpg)
OF FUTURE PROXY MATERIALS
By order of the Board of Directors,
W. Scott Seeley
Vice President, Compliance & Corporate Secretary
Juno Beach, Florida
April 1, 2022
IMPORTANT NOTICE REGARDING THE AVAILABILITYwhile reducing environmental impacts and costs.
| | | As one of the largest electric power and energy infrastructure companies in North America and a leader in the renewable energy industry, NextEra Energy is committed to building a sustainable energy future that is affordable, reliable and clean. We encourage our shareholders to enroll in e-delivery: | | |
| | | | Online at www.proxyvote.com/NEE | | |
| | | | Scan the QR code | |
THE ANNUAL MEETING TO BE HELD MAY 19, 2022
This proxy statement and the NextEra Energy 2021 annual report to shareholders are available at www.proxyvote.com.
Meeting Information
![[MISSING IMAGE: ic_caln-bw.gif]](https://capedge.com/proxy/DEF 14A/0001104659-24-041966/ic_caln-bw.gif) | | | TIME AND DATE | | | | | | PLACE | | | | | | RECORD DATE | | ||
| 8:00 a.m., | | | | 145 Town Center Ave., Big Sky, Montana 59716 | | | | March 26, 2024 | | ||||||||
| | | WEBCAST | | | | | | VOTING | | | | | | ADMISSION | | |||
|
| |||||||||||||||||
|
| |||||||||||||||||
| The Company will provide a live audio webcast of the annual meeting from its website at http:// | |||||||||||||||||
| www.nexteraenergy.com. | ||||||||||||||||||
| | | Shareholders as of the record date are entitled to vote. Each share of common stock, par value $.01 per share (“common stock”), is entitled to one vote for each director nominee and one vote for each of the other properly presented proposals to be voted. | |||||||||||||||
| | | An admission ticket is required to enter the annual meeting. See page | | ||||||||||||||
Voting Matters and Board Recommendations
| | PROPOSAL | | | BOARD VOTE RECOMMENDATION | | | PAGE REFERENCE | | ||||||
| | 1. | | | Election of directors | | | | | FOR each nominee | | | | ||
| | 2. | | | Ratification of appointment of Deloitte & Touche LLP as NextEra Energy’s independent registered public accounting firm for 2024 | | | | | FOR | | | | ||
| | 3. | | | Advisory vote to approve NextEra Energy’s compensation of its named executive officers | | | | | FOR | | | | ||
| | 4. | | | Shareholder Proposal – Board Matrix | | | | | AGAINST | | | | ||
| | 5. | | | Shareholder Proposal – Climate Lobbying Report | | | | | AGAINST | | | | ||
| | | BY INTERNET | | | | | | BY TELEPHONE | | | | | | BY | | | | | | IN PERSON | | ||||
| |||||||||||||||||||||||||
| |||||||||||||||||||||||||
| |||||||||||||||||||||||||
| |||||||||||||||||||||||||
| |||||||||||||||||||||||||
| |||||||||||||||||||||||||
How to Vote
|
Go to the website www.proxyvote.com, 24 hours a day, seven days a week. You will need the control number that appears on your proxy card or on your Notice of Internet Availability of Proxy Materials (the “Notice”). | ||||||
| |
| Call 1-800-690-6903, 24 hours a day, seven days a week. You will need the control number that appears on your proxy card or Notice. | ||||
| |
| If you received a full paper set of materials, date and sign your proxy card exactly as your name appears on your proxy card and mail it in the enclosed, postage-paid envelope. If you received the Notice, you may request a proxy card by following the instructions in your Notice. Even if you received a full paper set of materials, you may still vote by internet or telephone. You do not need to mail the proxy card if you are voting by internet or telephone. | ||||
| |
| At the annual meeting. | | |||


1
Business Highlights
| | | | | | | | | | | | ||||
| | ~72 GW* in operation | | | | ~9,000 MEGAWATT (“MW”) wind, solar and storage origination at NextEra Energy Resources, LLC (“NextEra Energy Resources”) | | | | ~16,800 employees | | | | ~$177 B in total assets | |
| | | | | | | | | | | | ||||
| | HURRICANE RESTORATION Florida Power & Light Company’s (“FPL”) smart grid technology avoided nearly 70,000 outages during Hurricane Idalia | | | | ~71; ~9% GAAP and adjusted earnings per share (“EPS”) growth compared to 2022 | | | | ~20 GW year-end backlog at NextEra Energy Resources | | | | ~50% below the national average CO2 emissions rate | |
| | | | | | | | | | | | ||||
| | 89% improvement in NextEra Energy overall company safety performance since 2003 | | | | ~$85-$95 B expected capital deployment from 2022 through 2025 | | | | 56% five-year total shareholder return (“TSR”), outperforming the S&P 500 Utilities Index | | | | 96% of FPL’s transmission structures are now concrete or steel | |
Governance Highlights
| | Metric | | | Rank | | | Detail | | |||
| | Adjusted EPS Growth* | | | | | #1 | | | | 3-, 5-, 7- and 10-year | |
| | Adjusted return on equity (“ROE”)* | | | | | #1 | | | | 1-, 3-, 5-, 7- and 10-year | |
In 2022, NextEra Energy was named by Fortune Magazine as the World’s Most Admired Electric & Gas Utility for the 15th time in the last 16 years. In 2021, Fortune recognized NextEra Energy on its list of companies that “change the world.” NextEra Energy was the only U.S. gas or electric utility to be so recognized in 2021.
The returns that NextEra Energy generated for its shareholders were attributable to outstanding 2021 performance by the Company’s two principal operating businesses, Florida Power & Light Company (“FPL”) and NextEra Energy Resources, LLC and its subsidiaries (“NextEra Energy Resources”). Highlightsa reconciliation of this performance are described in more detail innon-GAAP financial measure to the Compensation Discussion & Analysis beginningmost directly comparable GAAP financial measure. See the 2023 Financial Performance Matrix section on page 39.
51 for more information on how the rankings are determined.
The chart below compares the Company’s TSR for the 1-, 3-, 5- and 10-year periods period ended December 31, 20212023 to the TSRs of the S&P 500 Electric Utilities Index, the S&P 500 Utilities Index, the Philadelphia Exchange Utility Sector Index (“UTY”)UTY, the S&P 500 and the S&P 500.500 Growth Index. NextEra Energy outperformed all of these indices over the periods shown with the exception of the S&P 500 1-year TSR. NextEra Energy’s outperformance in comparison to others in its industry, and over the 3-, 5- and 10-year periods in comparison to the S&P 500, was substantial.
NextEra Energy Total Shareholder Return Through 12-31-21 vs. Various Indices period shown.
1-year TSR | 3-year TSR | 5-year TSR | 10-year TSR | |||||||||||||||||
NextEra Energy |
| 23 | % |
| 129 | % |
| 252 | % |
| 710 | % | ||||||||
S&P 500 Electric Utilities Index, total return |
| 19 | % |
| 56 | % |
| 80 | % |
| 177 | % | ||||||||
S&P 500 Utilities Index, total return |
| 18 | % |
| 49 | % |
| 74 | % |
| 185 | % | ||||||||
UTY, total return |
| 18 | % |
| 54 | % |
| 80 | % |
| 182 | % | ||||||||
S&P 500, total return |
| 29 | % |
| 100 | % |
| 133 | % |
| 363 | % | ||||||||
![[MISSING IMAGE: bc_share-pn.jpg]](https://capedge.com/proxy/DEF 14A/0001104659-24-041966/bc_share-pn.jpg)
|
|
|
2
Governance Highlights
| | 10-YEAR TSR | | ||||||
| | NextEra Energy | | | | | 267% | | |
| S&P 500 Electric Utilities Index, total return |
| | | | 146% | | | |
| | S&P 500 Utilities Index, total return | | | | | 135% | | |
| | UTY, total return | | | | | 133% | | |
| | S&P 500, total return | | | | | 211% | | |
| | S&P 500 Growth Index, total return | | | | | 250% | | |
| | | | | | | | | | | | ||||
| | DIRECTOR INDEPENDENCE | | | | BOARD LEADERSHIP | | | | BOARD ACCOUNTABILITY | | | | BOARD EVALUATION & EFFECTIVENESS | |
| | » 10 of
» CEO is the only non-independent
» All members of | |||||||||||||
| |
| » Independent Lead Director selected by the independent directors
» Lead Director has strong role and significant governance duties, including chairing | ||||||||||||
» As part of our Fall shareholder outreach program, Lead Director communicated directly with 30.9% of outstanding shares | ||||||||||||||
| |
| » All directors stand for election annually and the Board has adopted a resignation policy for directors who fail to receive the required vote in uncontested elections
» Simple majority voting standard for all uncontested director elections
» Shareholders of 20% or more of the outstanding shares may call a special meeting
» No shareholder rights (“poison pill”) plan
» No supermajority vote requirements in the Company’s Articles of Incorporation | ||||||||||||
| |
| » Annual Board and committee
» Annual independent director evaluation of the | |
| | | | | | | | | | | | | | | |||||
| | BOARD REFRESHMENT & DIVERSITY | | | | DIRECTOR ENGAGEMENT | | | | CLAWBACK & ANTI-HEDGING POLICIES | | | | SHARE OWNERSHIP | | | | PROXY ACCESS | |
» Balance of new and experienced directors, with tenure of director nominees averaging
» Specified retirement age for directors
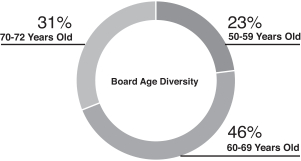
» 36% of » Average age of » 18% of | ||||||||||||||||||
| director nominees are ethnically diverse | ||||||||||||||||||
| |
| » All current directors
» Board policy limits non-employee director membership on other public company boards to three | ||||||||||||||||
| |
| » Recoupment or clawback policy to recover certain executive pay
» Policy prohibiting short sales, hedging and margin accounts | ||||||||||||||||
» Updated clawback policy to comply with NYSE rules | ||||||||||||||||||
| |
| » CEO required to hold shares equivalent to 7x base salary
» All senior executives required to hold
» Directors required to hold shares equivalent to 7x the cash portion of their annual retainer | ||||||||||||||||
| |
| » Available to a shareholder, or group of up to 20 shareholders, owning 3% of the Company’s outstanding shares for at least
» May nominate candidates for the greater of | |
3
2021 Environmental, Social*
Enhanced ESG Reporting.
![[MISSING IMAGE: tm2228016d1-pht_report4c.jpg]](https://capedge.com/proxy/DEF 14A/0001104659-24-041966/tm2228016d1-pht_report4c.jpg)
| | | | | | | | | | |||||
| | Emission Reduction The Company’s goal to |
| | | | The Company’s CO2 emissions rate in | | | | FPL’s generation fleet is one of the cleanest and most efficient in the country, saving Florida customers more than ~$15 billion in avoided fuel costs* | | | | 0 FPL has no coal-fired power generation in Florida | | ||
| | | | | | | | | | | | ||||
| | 25%WOMEN / 41%MINORITIES The diversity of our employees in 2022, including 25% women and 41% minorities in our workforce, with 27% and 29%, respectively, in our management ranks | | | | ~1.2 B Awarded, in the most recent federal reporting period, ~$1.2 billion in purchase contracts to minority- and women- owned businesses | | | | SUSTAINABILITY FOCUS The Board’s oversight process of sustainability issues, with a particular focus on the sustainability of our business | | | | SHAREHOLDER ENGAGEMENT Our successful shareholder engagement efforts, which ensure that the Company’s management and the Board better understand shareholder priorities and perspectives and enables us to effectively address the issues that matter most to our shareholders | |
FPL’s “30-by-30” plan to install 30 million solar panels in Florida by 2030 achieved a major milestone by completing approximately 40%
FPL’s
The Company’s awarding, in the most recent federal reporting period, $633 million in purchase contracts to small, minority and veteran owned businesses;
The Board’s oversight process of ESG issues, with a particular focus on the sustainability of our business; and
Our successful shareholder engagement efforts, which ensure that the Company’s management and the Board better understand shareholder priorities and perspectives.
The 2021 ESG2023 Sustainability Report also includes disclosure within the following established environmental reporting frameworks:
Additionally, in 2021, the Company participated in the Carbon Disclosure Project (“CDP”) survey for the first time in over ten years and received an “A level” leadership score. The Company’s response is available at http://www.investor.nexteraenergy.com/sustainability/esg-resources.
sustainability- resources under Related Information.
| | Additionally, in 2023, the Company again participated in the Carbon Disclosure Project (“CDP”) survey. ![[MISSING IMAGE: tm2228016d1-lg_cdp4c.jpg]](https://capedge.com/proxy/DEF 14A/0001104659-24-041966/tm2228016d1-lg_cdp4c.jpg) | | | | The Company’s 2023 Sustainability Report and CDP survey response are available at: | |
4
The Board of Directors also has oversight of certain social topics relevant to the Company. The Board reviews the Company’s diversity and inclusion and talent management strategy at least annually, including human capital and diversity metrics. The Board also focuses on diversity in the Company’s talent pipeline and reviews the diversity metrics of the Company’s internship program.
Information Security. NextEra Energy’s Audit Committee receives regular reports on the key risks facing the Company from the Corporate Risk Committee and also receives frequent reports from the Company’s Internal Auditor about the results of reviews of cybersecurity and information security governance. The Board annually receives a cybersecurity report from the Company’s Chief Information Officer and its Vice President, IT Infrastructure & Cybersecurity.
Varying leading third parties periodically assess the Company’s alignment with the U.S. Department of Energy’s Cyber Capability Maturity Model (a/k/a C2M2) standard, which is the predominate cyber security framework for the U.S. electric utility industry. NextEra Energy has a comprehensive cybersecurity training program in which all employees receive education and training on prevention of cybersecurity problems and on privacy and data protection.
No Changes to Compensation Awards or Plans. In light of the Company’s superior performance despite the COVID-19 pandemic, no changes to prior compensation awards or previously established compensation plans were necessary or appropriate in 2021 and no such changes are planned for 2022.
The Company plans to continue its outreach during 2022 on these and other ESG topics.
5
In 2023, we reached out to 73 of our 100 largest shareholders, representing approximately 58.3% of shares outstanding (including all top 50 shareholders), and offered to engage on matters important to them, including governance and compensation. We held engagements with 22 shareholders representing approximately 36.3% of the Company’s shares outstanding, and received valuable feedback on our governance and compensation program. Our Lead Director, Sherry S. Barrat, participated in 8 shareholder engagements, representing 30.9% of shares outstanding. The feedback we received was shared with the full Board and has been considered in certain enhancements we have made to our executive compensation program and related disclosures as described in more detail on page 42. ![[MISSING IMAGE: fc_business-pn.jpg]](https://capedge.com/proxy/DEF 14A/0001104659-24-041966/fc_business-pn.jpg)
ProposalPROPOSAL 1: Election as directors of the nominees specified in this proxy statement
| | ![[MISSING IMAGE: ph_nicolesarnaboldi-bwlr.jpg]](https://capedge.com/proxy/DEF 14A/0001104659-24-041966/ph_nicolesarnaboldi-bwlr.jpg) | | | | ![[MISSING IMAGE: ph_jameslcamaren-bw.jpg]](https://capedge.com/proxy/DEF 14A/0001104659-24-041966/ph_jameslcamaren-bw.jpg) | | | | ![[MISSING IMAGE: ph_gursahaney-bw.jpg]](https://capedge.com/proxy/DEF 14A/0001104659-24-041966/ph_gursahaney-bw.jpg) | | | | ![[MISSING IMAGE: ph_kirkhachigian-bw.jpg]](https://capedge.com/proxy/DEF 14A/0001104659-24-041966/ph_kirkhachigian-bw.jpg) | | | | ![[MISSING IMAGE: ph_mariahenry-bwlr.jpg]](https://capedge.com/proxy/DEF 14A/0001104659-24-041966/ph_mariahenry-bwlr.jpg) | | | | | |
| | Nicole S. Arnaboldi | | | | James L. Camaren | | | | Naren K. Gursahaney | | | | Kirk S. Hachigian | | | | Maria G. Henry | | | | ||
| | ![[MISSING IMAGE: ph_johnketchumsm-bw.jpg]](https://capedge.com/proxy/DEF 14A/0001104659-24-041966/ph_johnketchumsm-bw.jpg) | | | | ![[MISSING IMAGE: ph_amylane-bw.jpg]](https://capedge.com/proxy/DEF 14A/0001104659-24-041966/ph_amylane-bw.jpg) | | | | ![[MISSING IMAGE: ph_davidporges-bwlr.jpg]](https://capedge.com/proxy/DEF 14A/0001104659-24-041966/ph_davidporges-bwlr.jpg) | | | | ![[MISSING IMAGE: ph_devstahlkopf-bw.jpg]](https://capedge.com/proxy/DEF 14A/0001104659-24-041966/ph_devstahlkopf-bw.jpg) | | | | ![[MISSING IMAGE: ph_johnstall-bw.jpg]](https://capedge.com/proxy/DEF 14A/0001104659-24-041966/ph_johnstall-bw.jpg) | | | | ![[MISSING IMAGE: ph_darrylwilson-bw.jpg]](https://capedge.com/proxy/DEF 14A/0001104659-24-041966/ph_darrylwilson-bw.jpg) | |
| | John W. Ketchum | | | | Amy B. Lane | | | | David L. Porges | | | | Deborah L. “Dev” Stahlkopf | | | | John A. Stall | | | | Darryl L. Wilson | |
diversity
board recruiting at every committee meeting.
6
self-evaluation, it reviews the criteria for skills, experience and diversity reflected in the Board’s membership and also reviews the Board’s process for identification, consideration, recruitment and nomination of prospective Board members.
John W. Ketchum, who was appointed to the Board in March 2022, is an incumbent nominee for election to the Board this year who previously has not been elected by the Company’s shareholders. Mr. Ketchum was appointed to the Board in connection with the implementation of the Company’s CEO succession plan. Under the Company’s Governance Guidelines, the Company’s CEO serves as a member of the Board. Mr. Ketchum has served as the Company’s CEO since March 2022 and has over nineteen years of experience with the Company, including as CEO of NextEra Energy Resources and as the Company’s executive vice president, finance and chief financial officer.
Additionally, John A. Stall
September 2023.
directors
resignation policy
7
Director Qualifications
qualifications
| | DIRECTOR QUALIFICATIONS | | | COMPETENCIES AND RELEVANCE TO NEXTERA ENERGY | | | BOARD COMPOSITION | | |||
| | Individuals who have served as a public company CEO | | | | | PUBLIC COMPANY CEO EXPERIENCE Experience serving as a CEO provides unique perspectives to help the Board independently oversee NextEra Energy’s CEO and management. Having this experience also increases the Board’s understanding and appreciation of the many facets of running a public company, including strategic planning, financial reporting, compliance and risk oversight. | | | ![[MISSING IMAGE: pc_publicceo-pn.gif]](https://capedge.com/proxy/DEF 14A/0001104659-24-041966/pc_publicceo-pn.gif) | | |
| | Demonstrated expertise in managing large, relatively complex organizations, such as leadership roles of a significant company or organization | | | | | STRATEGY EXPERTISE Our Company operates in a quickly changing industry with new developing technologies. Having experience in developing and implementing strategic plans helps enable the Board to oversee and pivot in rapidly changing environments. | | | ![[MISSING IMAGE: pc_strategyexpert-pn.gif]](https://capedge.com/proxy/DEF 14A/0001104659-24-041966/pc_strategyexpert-pn.gif) | | |
| | | | OPERATIONS MANAGEMENT AND LEADERSHIP Our Company has a strong focus on cost and customer value, as well as innovation. Having experience with operations assists the Board in understanding the issues that the Company faces in achieving its industry-leading operating and maintenance (“O&M”) initiatives and reducing costs. | | | ![[MISSING IMAGE: pc_leadership-pn.gif]](https://capedge.com/proxy/DEF 14A/0001104659-24-041966/pc_leadership-pn.gif) | | ||||
| | | | MERGERS & ACQUISITIONS EXPERIENCE Our Company from time to time acquires and disposes of businesses and assets. An understanding of mergers & acquisitions helps the Board evaluate any future transactions and any associated opportunities and risks. | | | ![[MISSING IMAGE: pc_mergers-pn.gif]](https://capedge.com/proxy/DEF 14A/0001104659-24-041966/pc_mergers-pn.gif) | | ||||
| | Experience leading a utility, energy company or other highly regulated organization, such as CEO or other leadership position | | | | | UTILITY/REGULATED INDUSTRY LEADERSHIP As a company in a highly regulated industry, experience in the utility industry or another regulated industry assists the Board in understanding the regulatory issues that the Company faces. | | | ![[MISSING IMAGE: pc_utility-pn.gif]](https://capedge.com/proxy/DEF 14A/0001104659-24-041966/pc_utility-pn.gif) | | |
| | | | ENERGY INDUSTRY LEADERSHIP It is important that the Board understand the energy industry and the complete energy industry value chain. Energy industry leadership assists the Board in understanding all aspects of the ongoing energy transition. | | | ![[MISSING IMAGE: pc_energy-pn.gif]](https://capedge.com/proxy/DEF 14A/0001104659-24-041966/pc_energy-pn.gif) | | ||||
| | Financial or other risk management expertise | | | | | FINANCIAL Our Company’s business involves complex financial management, capital allocation and reporting issues. An understanding of finance and financial reporting is valuable in order to promote effective capital allocation and robust controls and oversight of accurate financial reporting. | | | ![[MISSING IMAGE: pc_financialrisk-pn.gif]](https://capedge.com/proxy/DEF 14A/0001104659-24-041966/pc_financialrisk-pn.gif) | | |
| | | | RISK MANAGEMENT The scale, scope and complexity of our Company’s business raises a variety of interdependent risks. Experience in effectively identifying, prioritizing and managing a broad spectrum of risks can help the Board appreciate, anticipate and oversee the Company in managing the risks that face its various businesses. | | | ![[MISSING IMAGE: pc_riskmanage-pn.gif]](https://capedge.com/proxy/DEF 14A/0001104659-24-041966/pc_riskmanage-pn.gif) | | ||||
| | DIRECTOR QUALIFICATIONS | | | COMPETENCIES AND RELEVANCE TO NEXTERA ENERGY | | | BOARD COMPOSITION | | |||
| | Experience serving in senior customer facing roles or in industries where customer service is strategically important | | | | | MARKETING, SALES AND CUSTOMER SERVICE EXPERIENCE FPL services over five million customer accounts in the state of Florida. NextEra Energy Resources also has a number of customer and consumer facing businesses serving thousands of customers. Experience in marketing, sales and customer service helps the Board oversee FPL’s best-in-class customer value proposition and NextEra Energy Resources’ growing consumer facing businesses. We also have customer and consumer facing businesses at NextEra Energy Resources. | | | ![[MISSING IMAGE: pc_marketing-pn.gif]](https://capedge.com/proxy/DEF 14A/0001104659-24-041966/pc_marketing-pn.gif) | | |
| | Experience in managing engineering and construction projects | | | | | ENGINEERING AND CONSTRUCTION LEADERSHIP In 2023, the Company invested approximately $25 billion in energy infrastructure and NextEra Energy Resources commissioned approximately 5,025 MWs of renewable energy projects. Board experience in engineering and construction leadership assists the Board in its oversight of our large-scale capital investments and on our timely and on budget capital project execution. | | | ![[MISSING IMAGE: pc_engineering-pn.gif]](https://capedge.com/proxy/DEF 14A/0001104659-24-041966/pc_engineering-pn.gif) | | |
| | Experience with information technology and cybersecurity | | | | | INFORMATION TECHNOLOGY LEADERSHIP Oversight of the protection of customer information and cybersecurity is critical to providing reliable electric service at both FPL and NextEra Energy Resources. Board experience in information technology leadership assists the Board in its oversight of our cybersecurity programs. | | | ![[MISSING IMAGE: pc_information-pn.gif]](https://capedge.com/proxy/DEF 14A/0001104659-24-041966/pc_information-pn.gif) | | |
| | Experience | | | Arnaboldi | | | Barrat | | | Camaren | | | Dunn | | | Gursahaney | | | Hachigian | | | Henry | | | Ketchum | | | Lane | | | Porges | | | Stahlkopf | | | Stall | | | Wilson | | ||||||||||||||||||||||||||||||||||||||||
Public Company CEO Experience
| |
| | | | | | | | | | | | | | | X | | | | | | | | | | | | X | | | | | | X | | | | | | | | | | | | X | | | | | | | | | | | | X | | | | | | | | | | | | | | | | | | | | | ||
| Financial Industry Experience & Leadership |
| |
| | X | | | | | | X | | | | | | X | | | | | | X | | | | | | X | | | | | | X | | | | | | X | | | | | | X | | | | | | X | | | | | | X | | | | | | | | | | | | | | | | | | | | | ||
| | Strategy Expertise | | | | | X | | | | | | X | | | | | | X | | | | | | | | | | | | X | | | | | | X | | | | | | X | | | | | | X | | | | | | X | | | | | | X | | | | | | X | | | | | | X | | | | | | X | | | |
| | Operations Management
| |
| | | | | | | | | | | | | | | | | | | | | | | | | | | X | | | | | | X | | | | | | X | | | | | | X | | | | | | | | | | | | X | | | | | | | | | | | | X | | | | | | X | | | |
| | International Experience | | | | | X | | | | | | | | | | | | X | | | | | | | | | | | | X | | | | | | X | | | | | | X | | | | | | X | | | | | | | | | | | | X | | | | | | X | | | | | | X | | | | | | X | | | |
| | Utility / Regulated Industry Leadership | | | | | X | | | | | | | | | | | | X | | | | | | | | | | | | | | | | | | | | | | | | | | | | | | X | | | | | | | | | | | | X | | | | | | | | | | | | X | | | | | | | | | |
| | Political / Legislative Experience | | | | | | | | | | | | | | | | | | | | | | | | | | | | | | | | | | | | | | | | | | | | | | | X | | | | | | | | | | | | | | | | | | X | | | | | | | | | | | | | | | |
| | Energy Industry Leadership | | | | | | | | | | | | | | | | | | | | | | | | | | | | | | | | | | | | | | | | | | | | | | | X | | | | | | | | | | | | X | | | | | | | | | | | | X | | | | | | X | | | |
| | Engineering & Construction Industry Experience | | | | | | | | | | | | | | | | | X | | | | | | | | | | | | X | | | | | | | | | | | | | | | | | | X | | | | | | | | | | | | X | | | | | | | | | | | | X | | | | | | | | | |
| | Nuclear Operations Leadership | | | | | | | | | | | | | | | | | | | | | | | | | | | | | | | | | | | | | | | | | | | | | | | X | | | | | | | | | | | | | | | | | | | | | | | | X | | | | | | | | | |
| | Risk Management Leadership | | | | | X | | | | | | X | | | | | | X | | | | | | X | | | | | | X | | | | | | X | | | | | | X | | | | | | X | | | | | | | | | | | | X | | | | | | X | | | | | | X | | | | | | X | | | |
| | Mergers & Acquisitions Experience
| |
| ||||||||||||||||||||||||||||||||||||||||||||||||||||||||||||||||||||||||||||||


8
| | | | X | | | | | | | | | | | | X | | | | | | | | | | | | X | | | | | | X | | | | | | X | | | | | | X | | | | | | X | | | | | | X | | | | | | | | | | | | | | | | | | X | | | ||||
| Information Technology / Cyber Experience | | | | | | | | | | | | | | | | | | | | | | | | | | | X | | | | | | | | | | | | X | | | | | | X | | | | | | | | | | | | | | | | | | X | | | | | | | | | | | | | | | ||||
| Investor Relations Management |
| |
| | | | | | | | | | | | | | X | | | | | | | | | | | | X | | | | | | X | | | | | | X | | | | | | X | | | | | | | | | | | | X | | | | | | | | | | | | | | | | | | | | | ||
| |
|
| |||||||||||||||||||||||||||||||||||||||||||||||||||||||||||||||||||||||||||||||
|
| ||||||||||||||||||||||||||||||||||||||||||||||||||||||||||||||||||||||||||||||||
|
| ||||||||||||||||||||||||||||||||||||||||||||||||||||||||||||||||||||||||||||||||
| Marketing / Sales
| |
| | | X | | | | | | X | | | | | | | | | | | | | | | | | | X | | | | | | X | | | | | | X | | | | | | X | | | | | | X | | | | | | | | | | | | | | | | | | | | | | | | X | | | |
| New Business Development/Development |
| |
|


9
| | | X | | | | | | X | | | | | | X | | | | | | | | | | | | X | | | | | | X | | | | | | X | | | | | | X | | | | | | X | | | | | | X | | | | | | | | | | | | | | | | | | X | | | ||||
| Human Resources Development | | | X | | | | | | X | | | | | | X | | | | | | X | | | | | | X | | | | | | X | | | | | | X | | | | | | X | | | | | | X | | | | | | X | | | | | | X | | | | | | X | | | | | | X | | | |||
| Trading/Derivatives |
| |
| | | | | | | | | | | | | | X | | | | | | X | | | | | | | | | | | | | | | | | | | | | | | | X | | | | | | X | | | | | | | | | | | | | | | | | | | | | | | | | | | |
| | Gender | | | | | | | | | | | | | | | | | | | | | | | | | | | | | | | | | | | | | | | | | | | | | | | | | | | | | | | | | | | | | | | | | | | | | | | | | | | | | | | |
| | Female | | | | | X | | | | | | X | | | | | | | | | | | | | | | | | | | | | | | | | | | | | | X | | | | | | | | | | | | X | | | | | | | | | | | | X | | | | | | | | | | | | | | |
| | Male | | | | | | | | | | | | | | | | | X | | | | | | X | | | | | | X | | | | | | X | | | | | | | | | | | | X | | | | | | | | | | | | X | | | | | | | | | | | | X | | | | | | X | | |

Board Gender and Race/Ethnic Diversity
![[MISSING IMAGE: pc_board-pn.jpg]](https://capedge.com/proxy/DEF 14A/0001104659-24-041966/pc_board-pn.jpg)
| | NICOLE S. ARNABOLDI | | | Age 65 | | | Independent director since 2022 | |
|  |
10
Board Committees » Audit » Finance & Investment Public Company
» Manulife Financial Corporation (since
| |
| Career Highlights Ms. Arnaboldi has been a partner at Oak Hill Capital Management since 2021. She was previously the vice chairman of 1996. | | | Qualifications
Ms. Arnaboldi has | |

| | JAMES L. CAMAREN | | | Age 69 | | | Independent director since 2002 | |
| | ||||||||
Board Committees » Compensation » Finance & Investment | | |||||||
| | ||||||||
|
Career Highlights Mr. Camaren is a private investor. Until May 2006, he was chairman and CEO of Utilities, Inc. which was one of the largest investor-owned water utilities in the United States until March 2002 when it was acquired by Nuon, a Dutch company, which subsequently sold Utilities, Inc. in April 2006. He joined Utilities, Inc. in 1987 and served successively as vice president of business development, executive vice president, and vice chairman, becoming chairman and CEO in 1996. | | | Qualifications Mr. Camaren has 19 years of leadership experience with a large, regulated investor-owned utility. During the years he served as chairman and CEO, the utility had customer growth at a rate that exceeded the industry average and acquired and integrated over 40 utilities. In addition, Mr. Camaren has experience in managing capital expenditures, environmental compliance, regulatory affairs and investor relations. | |

11
| | NAREN K. GURSAHANEY | | | Age 62 | | | Independent director since 2014 | |
|
Board Committees » Audit (Chair) » Executive » Governance &
| |||||||
Nominating Public Company
» Stericycle, Inc. (since | |
| Career Highlights Mr. Gursahaney is retired. He served as the president and CEO, and a member of the board of directors, of The ADT Corporation (“ADT”), a provider of security systems and services, from September 2012 until its acquisition by affiliated funds of Apollo Global Management LLC in May 2016. Prior to ADT’s separation from Tyco International Ltd. (“Tyco”) in September 2012, Mr. Gursahaney served as president of Tyco’s ADT North American Residential business segment and was the president of Tyco Security Solutions, then a provider of electronic security to residential, commercial, industrial and governmental customers and the largest operating segment of Tyco. Mr. Gursahaney joined Tyco in 2003 as senior vice president of operational excellence. He then served as president of Tyco Engineered Products and Services and president of Tyco Flow Control. Prior to joining Tyco, Mr. Gursahaney was president and CEO of GE Medical Systems Asia, where he was responsible for the company’s sales and services business in the Asia-Pacific region. During his 10-year career with GE, Mr. Gursahaney held senior leadership roles in services, marketing and information management. | | | Qualifications Mr. Gursahaney has extensive operations, strategic planning and leadership experience in global manufacturing and services businesses serving residential, commercial, industrial and governmental customers gained as the CEO of a public company providing security systems and service. He also has extensive global operations, information technology and service experience gained as the president and CEO of the Asia-Pacific division of a medical diagnostic and imaging manufacturer. He has | | |


12
| | KIRK S. HACHIGIAN | | | Age 64 | | | Independent director since 2013 | |
| Board Committees » Compensation (Chair) » Executive » Governance & Nominating Public Company
» Allegion plc (since 2013) » PACCAR, Inc. (since 2008)
» L3 Harris Technologies, Inc. (since | |
| Career Highlights Mr. Hachigian served as chairman of the board of JELD-WEN Holding, Inc., a manufacturer of windows and doors, from April 2014 until May 2018. He also served as CEO of JELD-WEN Holding, Inc. from April 2014 until November 2015. He served as chairman, president and CEO of Cooper Industries plc (“Cooper”), a publicly held electrical equipment and tool manufacturer, until Cooper’s acquisition by Eaton Corporation plc in November 2012. He was named chairman of Cooper in 2006, CEO in 2005 and president in 2004. | | | Qualifications Mr. Hachigian has extensive leadership, operations and strategic planning experience gained through his prior service as the chairman, CEO and president of a global, publicly held manufacturer of electrical equipment and tools. He also has international leadership and operations experience gained through his prior service as the president and CEO of the Asia-Pacific operations of a lighting products manufacturer and in key management positions in Singapore and Mexico. In addition, Mr. Hachigian has financial and risk oversight experience developed through his prior service on the audit committee of another public company and as a prior member of the board of the Houston branch of the Federal Reserve Bank of Dallas. He has | |

| | MARIA G. HENRY | | | Age: 57 | | | Independent director since 2023 | |
| | Board Committees » Finance & Investment Public Company Boards » General Mills, Inc. (since 2016) » NIKE, Inc. (since May 2023) | | | Career Highlights Ms. Henry was chief financial officer of Kimberly-Clark Corporation from April 2015 through April 2022, and served as executive vice president and senior advisor of Kimberly-Clark Corporation from April 2022 until her retirement in September 2022. Prior to Kimberly-Clark, Ms. Henry was executive vice president and chief financial officer of the Hillshire Brands Company, formerly known as Sara Lee Corporation, from 2012 to 2014. She was the chief financial officer of Sara Lee’s North American Retail and Foodservice business from 2011 to 2012. Prior to Sara Lee, Ms. Henry held various senior leadership positions in finance and strategy in three portfolio companies of Clayton, Dubilier & Rice, most recently as executive vice president and chief financial officer of Culligan International. She also held senior finance roles in several technology companies and began her career at General Electric. | | | Qualifications Ms. Henry has extensive leadership experience in finance and strategy for large global public, private equity controlled, and smaller entrepreneurial companies across consumer, technology, manufacturing and distribution industries. She has had oversight responsibility for finance, treasury, investor relations, strategy, real estate and accounting. She also has experience overseeing information technology and risk, including cyber risk. Ms. Henry currently serves on the boards of directors of NIKE, Inc. and General Mills, Inc. She holds a Bachelor of Science degree in finance from the University of Maryland. | |
| | JOHN W. KETCHUM | | | Age 53 | | | Director since 2022 | |
| | ||||||||
13
Board Committees » Executive (Chair) » Nuclear Public Company
» NextEra Energy Partners, LP (since 2017) | |
| Career Highlights Mr. Ketchum has been president and own contracted clean energy projects (in which the Company owns an underlying 52.6% interest). | | | Qualifications Mr. Ketchum has a diverse business, finance and legal background with a broad range of experiences gained through his key executive roles at NextEra Energy, NextEra Energy Resources and NEP. During his | |

| | AMY B. LANE | | | Age 71 | | | Independent director since 2015 | |
| | ||||||||
14
Board Committees » Executive » Finance & Investment » Governance & Nominating (Chair) Public Company
» FedEx Corp. (since 2022) » The TJX Companies, Inc. (since 2005)
| |
| Career Highlights Ms. Lane retired in 2002 as managing director and group leader of the global Retailing Investment Banking Group of Merrill Lynch & Co., Inc. (“Merrill Lynch”), an investment banking firm. Prior to joining Merrill Lynch in 1997, she was a managing director at Salomon Brothers, Inc. (“Salomon Brothers”), an investment banking firm, where she founded and led the retail industry investment banking unit, having joined Salomon Brothers in 1989. | | | Qualifications Ms. Lane has 26 years of leadership experience with financial services, capital markets, finance and accounting, capital structure, and acquisitions and divestitures in the financial services industry, as well as extensive experience in management, leadership and strategy. Ms. Lane served as a managing director and group leader of the global Retailing Investment Banking Group at Merrill Lynch from 1997 until her retirement in 2002. In that role, she led and worked on mergers and acquisitions and equity and debt transactions for a wide range of major retailers. Prior to joining Merrill Lynch, she was a managing director at Salomon Brothers, which she joined in 1989 and where she founded and led the retail industry investment banking unit. Ms. Lane has | |

| | DAVID L. PORGES | | | Age 66 | | | Independent director since 2020 | |
| | ||||||||
Board Committees » Executive » Finance & Investment (Chair) » Governance & Nominating | | |||||||
| | ||||||||
|
Career Highlights Mr. Porges was a non-employee member of the board of directors of Equitrans Midstream Corporation (“Equitrans”) from November 2018 through December 2019 and was the chairman of the board of Equitrans from November 2018 to July 2019. He joined EQT Corporation (“EQT”) in 1998 as senior vice president and chief financial officer and served as EQT’s CEO from April 2010 to April 2011 and as CEO and chairman from April 2011 to February 2017. From February 2017 to March 2018, Mr. Porges served as EQT’s executive chairman and as chairman and interim CEO from March 2018 to November 2018. | | | Qualifications Mr. Porges has more than 20 years of leadership, finance, operations and mergers and acquisitions experience gained through his prior service as CEO and chairman of a publicly held energy industry company, as well as his prior service as the chief financial officer of that energy company. Mr. Porges also has experience with capital markets, finance and mergers and acquisitions | |

15
| | DEBORAH L. “DEV” STAHLKOPF | | | Age 54 | | | Independent director since 2023 | | |
| Board Committees » Audit » Compensation | | | Career Highlights Ms. Stahlkopf joined Cisco Systems, Inc. |
| | | Qualifications Ms. Stahlkopf has extensive experience in | |

16
|
| ||
|
| | |


| | JOHN A. STALL | | | Age 69 | | | Independent director since 2022 | |
| Board Committees » Audit » Nuclear (Chair) |
| | Career Highlights Mr. Stall retired from NextEra Energy in 2010, where he served in numerous nuclear leadership roles. He served as president of NextEra Energy’s nuclear division from 2009 to 2010, as senior vice president and chief nuclear officer from 2001 to 2009, as vice | | | Qualifications Mr. Stall has substantial nuclear expertise, operations and engineering experience and leadership experience. He has over 40 years of experience in nuclear generation through his career at both Dominion Energy, Inc. and NextEra Energy. He previously held a senior reactor operator license issued by the Nuclear Regulatory Commission and is a previously licensed professional engineer in the Commonwealth of Virginia. He served as the chair of an independent nuclear safety advisory committee for a publicly-traded electric utility that operates multiple nuclear generating units. He served as a member of the Institute of Nuclear Power Operations National Academy of Nuclear Training Accrediting Board from 2008 to 2019. Mr. Stall graduated from the University of Florida and holds a Bachelor of Science degree in nuclear engineering. He received his MBA from Virginia Commonwealth University. | |

| | DARRYL L. WILSON | | | Age 60 | | | Independent director since 2018 | |
| | ||||||||
Board Committees » Audit » Compensation Public Company
» Eaton Corporation plc (since 2021) » Primerica, Inc. (since February 2024) | |
| Career Highlights Mr. Wilson was vice president, commercial of GE Power, a business of GE, from June 2017 until his retirement in December 2017. From January 2016 to June 2017, he was vice president & chief commercial officer of GE Energy Connections and, from January 2013 to January 2016, he was vice president & chief commercial officer of GE Distributed Power. From July 2008 to January 2013, he was president & CEO of GE Aeroderivative Products. Additionally, Mr. Wilson spent 6 years in progressive executive leader roles with British Petroleum —North America in business operations and regional fuel and lubricant distribution management positions. | | | Qualifications Mr. Wilson has extensive leadership and international experience in business operations, commercial management, global manufacturing, mergers and acquisitions and services as a result of his senior leadership roles for a global manufacturer and service provider of | | |

| | | | | The Board unanimously recommends a vote FOR the election of all nominees. | | |
The Board unanimously recommends a vote FOR
18
ProposalPROPOSAL 2: Ratification of appointment of Deloitte RATIFICATION OF APPOINTMENT OF DELOITTE & ToucheTOUCHE LLP as NextEra Energy’s independent registered public accounting firm for 2022
| | | | | The Board unanimously recommends a vote FOR ratification of appointment of Deloitte & Touche LLP as NextEra Energy’s independent registered public accounting firm for 2024. | | |
The Board unanimously recommends a vote FOR ratification
19
ProposalPROPOSAL 3: Approval, by non-binding advisory vote, of NextEra Energy’s compensation of its named executive officers as disclosed in this proxy statement
NextEra Energy Total Shareholder Return Through 12-31-21 vs. Various Indices(1)
1-year TSR | 3-year TSR | 5-year TSR | 10-year TSR | |||||
NextEra Energy | 23% | 129% | 252% | 710% | ||||
S&P 500 Electric Utilities Index, total return | 19% | 56% | 80% | 177% | ||||
S&P 500 Utilities Index, total return | 18% | 49% | 74% | 185% | ||||
UTY, total return | 18% | 54% | 80% | 182% | ||||
S&P 500, total return | 29% | 100% | 133% | 363% | ||||
| | | 10-YEAR TSR | | ||||
| | NextEra Energy | | | | | 267% | | |
| | S&P 500 Electric Utilities Index, total return | | | | | 146% | | |
| | S&P 500 Utilities Index, total return | | | | | 135% | | |
| | UTY, | | | | | 133% | | |
| | S&P 500, total return | | | | | 211% | | |
| | S&P 500 Growth Index, total return | | | | | 250% | | |
| | | | | The Board unanimously recommends a vote FOR approval, by non-binding advisory vote, of NextEra Energy’s compensation of its named executive officers, as disclosed in this proxy statement. | | |
20
for consideration at the annual meeting. In accordance with Securities and Exchange Commission (“SEC”) regulations, the text of thisthe shareholder proposal and supporting statement appearappears exactly as received by the Company. The shareholder proposal may contain assertions about the Company or other matters that the Company believes are incorrect, but the Company has not attempted to refute all of those assertions. All statements contained in the shareholder proposal and supporting statement are the sole responsibility of the proponent. The Company disclaims responsibility for the content of the proposal and the supporting statement.
Furthermore,
Moreover, in its 2021 proxy statement, NextEra provides no particularized data with respect to how its directors’ different qualifications fit together to effectively fulfill the Board’s oversight responsibilities, nor did it explicitly disclose each director’s self-identified race or ethnicity. Carbon-based sources account for roughly half of NextEra’s generating capacity, underscoring the need for a climate-competent Board.
We would also encourage companies to disclose, in aggregate, the number of any self-identified LGBTQ+ director(s).
21
Other leading companies,Your peers, such as Intel, 3M, Home Depot,Exelon Corporation, Honeywell International Inc., and Wells FargoConsolidated Edison have published a Board Matrix with individualized director data in a decision-useful format.data. Their matrices also use EEO-1 categories for disclosing the diversity of individual directors, which allows for consistent and comparable data.
The Board unanimously recommends a vote AGAINST
| | | | | The Board unanimously recommends a vote AGAINST the foregoing proposal for the following reasons: | | |
shareholders because the Board has included a matrix, by individual Board member, of each director’s gender and skills and attributes that are most relevant to the Company’s overall business strategy.
Diversity of experiences and backgrounds are important considerations in identifying and assessing Board candidates. format by current individual director.
NextEra Energy has supplemented its disclosure about Board members skills and attributes.
After conferringcomplied with the proponent, the Company supplementedproposal’s most important request. Supporting this year’s proxy statement with several enhancements, including: a detailed matrix allowing shareholders to easily judge the collective competencies of the Board; clarity between Board qualifications and the competencies sought for director candidates; descriptions of the relevance of each competency to NextEra Energy’s business; and infographics separately identifying the Board’s gender diversity, racial/ethnic diversity and age diversity. This isproposal will not result in addition to the data previously disclosed, including lists of the qualifications and competencies sought by the Board. Additionally, the Board has considered diversity consistently as it engagesany substantial increase in candidate searches.
The Board functions as a collective body on behalf of all the Company’s shareholders.
The imposition of a prescriptive matrix byinformation about individual director can promote a check-the-box approach to refreshment, thus increasing the risk of bypassing a well-qualified candidate, and may mislead shareholders into wrongly believing that only a subset of directors contribute to particular decisions or represent the Board on particular matters. Instead, thedirectors.
| | | | | For the above reasons, the Board unanimously recommends a vote AGAINST this proposal. | | |
For
22
for consideration at the annual meeting. In accordance with SECSecurities and Exchange Commission (“SEC”) regulations, the text of thisthe shareholder proposal and supporting statement appearappears exactly as received by the Company. The shareholder proposal may contain assertions about the Company or other matters that the Company believes are incorrect, but the Company has not attempted to refute all of those assertions. All statements contained in the shareholder proposal and supporting statement are the sole responsibility of the proponent. The Company disclaims responsibility for the content of the proposal and the supporting statement.
Resolved: Shareholders request5
Supporting Statement: Quantitative data is sought so that investors can assess, understand, and compare the effectiveness of companies’ diversity, equity, and inclusion programs and apply this analysis to investors’ portfolio management and securities’ selection process.
Whereas: Numerous studies by respected organizations such as The Wall Street Journal, Credit Suisse, Morgan Stanley, McKinsey, PwC and BCG have pointed to the material benefits of a diverse workforce.
Companies should look to hire the best talent. However, Black and Latino applicants face recruitment challenges. Results of a meta-analysis study of 24 field experiments, dating back to 1990, found that, with identical resumes, White applicants receive an average of 36 percent more callbacks than Black applicants and 24 percent more callbacks than Latino applicants.”latest benchmark criteria
Promotion rates show how well diverse talent is nurtured at a company. Unfortunately, women and non-White employees experience “a broken rung” in their careers. For every 100 men who are promoted, only 86 women are promoted. Non-White women are particularly impacted, comprising 17 percent of entry-level workforce and only
Morgan Stanley has found that “Employee retention that is above industry peer averages can indicate the presence of competitive advantage. This advantage may lead to higher levels of future profitability than past financial performance would indicate.”3 Companies with high employee satisfaction have also been linked to annualized outperformance of over two percent.4
NextEra Energy has not yet committed to release standardized workforce composition data through its consolidated EEO-1 form, which is best practice in diversity data reporting. Nor has it shared sufficient recruitment, retention, and promotion data to allow investors to determine the effectiveness of its human capital management programs.
|
|
|
|
Eighty-one percent
By providing clear, quantitative data on workforce composition, promotion, and retention rates NextEra Energy can help assure that investors are able to compare NextEra Energy’s diversity programs to those of its peers.
The Board unanimously recommends a vote AGAINST the foregoing proposal for the following reasons:
| | | | | The Board unanimously recommends a vote AGAINST the foregoing proposal for the following reasons: | | |
NextEra Energy is committed to diversity, equity and inclusion (“DEI”).
NextEra Energy’s culture and people are among its most important resources and a key competitive advantage. NextEra Energy is committed to attracting and maintaining a diverse workforce. This commitment is supported by the highest levels of Company leadership, as evidenced by the active role that the Company’s management and the Board play in monitoring, evaluating and overseeing the Company’s DEI efforts. The Company’s Executive Diversity & Inclusion (“D&I”) Council is dedicated to advising and driving corporate DEI strategy and partnering with business units in order to promote diverse talent development and recruitment, as highlighted in the Company’s 2021 ESG Report1 and D&I website2. The Executive D&I Council reviews D&I metrics on a quarterly basis, which showcases the Company’s commitment to data-driven results. Such metrics are used to develop annual D&I plans, track progress and implement the Company’s strategies, and are reviewed at least annually by the Board.
In addition, members of the Company’s Corporate D&I Council act as business unit champions by driving business unit D&I strategies, sharing best practices, sponsoring the Company’s annual D&I Summit and advising and mentoring employee resource groups (“ERGs”). The Company’s twelve ERGs are at the heart of the Company’s engagement efforts on DEI. It is within these all-volunteer groups that team members and allies partner to develop personal and professional skills, drive cultural competency and demonstrate advocacy. Examples of the Company’s ERGs include the African-American Professional Employee Group, the Hispanic Organization for Latino Americans, Asian Professionals in the Energy Exchange and Women in Energy, among others.
NextEra Energy already provides extensive information on its DEI efforts and has posted its consolidated EEO-1 reports.
|
|
24
Hawaiian or Other Pacific Islander, two or more races, and Native American or Alaskan Native (2%). The Company plans to provide annual updates to its future ESG reports.
Recognizing that thereshareholder proposal, is a high degree of interest in additional diversity disclosures, the Company has posted its three most recent consolidated EEO-1 reports on the Company’s website3available at www.investor.nexteraenergy.com/corporate-governance. The Company has committedmade a reasonable effort to disclosing its consolidated EEO-1make the disclosures sought by the proponent and plans to update the report to reflect any material changes in lobbying strategy.
review of trade association memberships by the Company’s Vice President, Government Affairs
—Federal. That officer has the responsibility to ensure proper alignment of the Company’s trade association activities with the objectives of the Company. The policy also requires that any policy positions that may be in conflict with the Company’s strategy and objectives are reviewed with the Company’s chairman to ensure that participation in these organizations continues to provide an overall benefit to the Company.The 2021 ESG Report highlights the Company’s focus on recruiting, retaininglobbying efforts, the Board believes the report requested by the proposal would be an unnecessary, duplicative and promoting a diverse and highly skilled workforce. These public materials discloseunproductive use of the Company’s efforts to attend recruiting events across the countrytime and engage with key talent pools, such as Women in Technology International, the National Black MBA Association and the American Indian Science and Engineering Society, as well as several veterans’ organizations. In addition, the 2021 ESG Report discusses the Company’s concerted effort to improve the recruitment, retention and promotion of Black team members4. In light of the continued focus on social justice and racial equity, a racial equity working group, including more than 100 team members, was established to make a positive contribution toward racial equity.
The racial equity working group’s accomplishments so far include:
Partnering with more than 50 organizations to increase Black recruiting opportunities;
Implementing a rotational development program and mentoring program for Black employees;
Supporting 19 key community programs that make a difference in Black communities such as the National Urban League, Black Girls CODE and the Center for Policing Equity;
Commitments to tripling spending with Black owned businesses by 2022; and
Commitments to invest more than $100 million in venture capital and private equity funds that are focused on improving racial equity.
NextEra Energy continues to be recognized for its DEI efforts.
Finally, the Company has also received external recognition for its DEI efforts. In 2021, the Company was named to Forbes magazine’s list of “America’s Best Employers for Diversity” for the fourth consecutive year. In addition, in 2020, the Company was selected by Winds of Change magazine as one of the “Top 50 Workplaces for Indigenous STEM Professionals” for the Company’s strong support for diversity and an inclusive work climate.
The Board does not believe the adoption of this proposal would enhance the Company’s commitment to DEI efforts and improved outcomes.
Unless you specify otherwise in your voting instructions, your proxy will be voted AGAINSTProposal proposal 5.
| | | | | For the above reasons, the Board unanimously recommends a vote AGAINST this proposal. | | |
Forabove reasons, the Board unanimously recommends a vote AGAINST this proposalCompany’s 2023 Sustainability Report, available at https://www.nexteraenergy.com/sustainability.html.
|
|
25
Common Stock Ownership of Certain Beneficial Owners and Management
| Name and Address of Beneficial Owner | Amount and Nature of Beneficial Ownership | Percent of Class | ||
The Vanguard Group 100 Vanguard Blvd. Malvern, PA 19355(1) | 178,849,315 | 9.12% | ||
BlackRock, Inc. 55 East 52nd Street New York, NY 10055(2) | 161,369,326 | 8.20% | ||
State Street Corporation State Street Financial Center One Lincoln Street Boston, MA 02111(3) | 99,606,550 | 5.08% | ||
|
|
|
26,
2024.| | NAME AND ADDRESS OF BENEFICIAL OWNER | | | AMOUNT AND NATURE OF BENEFICIAL OWNERSHIP | | | PERCENT OF CLASS | | ||||||
| | The Vanguard Group(1) 100 Vanguard Blvd. Malvern, PA 19355 | | | | | 198,664,863 | | | | | | 9.7% | | |
| | BlackRock, Inc.(2) 55 East 52nd Street New York, NY 10055 | | | | | 151,490,645 | | | | | | 7.4% | | |
| | State Street Corporation(3) State Street Financial Center One Lincoln Street Boston, MA 02111 | | | | | 116,304,947 | | | | | | 5.75% | | |
| Common Stock Beneficially Owned | Phantom/Deferred Shares(4) | |||||||||||||||
| Name | Shares Owned(1) | Shares Which May Be Acquired Within 60 Days(2) | Total Shares Beneficially Owned(3) | |||||||||||||
Sherry S. Barrat |
| 99,841 |
|
| 11,143 |
|
| 110,984 |
|
| 62,483 |
| ||||
James L. Camaren |
| 149,930 |
|
| - |
|
| 149,930 |
|
| 30,651 |
| ||||
Kenneth B. Dunn |
| 76,570 |
|
| - |
|
| 76,570 |
|
| - |
| ||||
Naren K. Gursahaney |
| 25,390 |
|
| 12,753 |
|
| 38,143 |
|
| - |
| ||||
Kirk S. Hachigian |
| 37,835 |
|
| - |
|
| 37,835 |
|
| - |
| ||||
John W. Ketchum |
| 129,684 |
|
| 463,595 |
|
| 593,279 |
|
| 16,598 |
| ||||
Rebecca J. Kujawa |
| 85,223 |
|
| 110,711 |
|
| 195,934 |
|
| 3,686 |
| ||||
Amy B. Lane |
| 21,193 |
|
| 18,789 |
|
| 39,982 |
|
| - |
| ||||
David L. Porges |
| 28,136 |
|
| 4,799 |
|
| 32,935 |
|
| 6,851 |
| ||||
| �� | ||||||||||||||||
James L. Robo |
| 1,278,372 | (5) |
| 3,233,561 |
|
| 4,511,933 |
|
| 1,570,257 |
| ||||
Rudy E. Schupp |
| 58,330 |
|
| - |
|
| 58,330 |
|
| - |
| ||||
Charles E. Sieving |
| 194,831 |
|
| 183,332 |
|
| 378,163 |
|
| 27,326 |
| ||||
Eric E. Silagy |
| 236,698 |
|
| 713,643 |
|
| 950,341 |
|
| 30,125 |
| ||||
John L. Skolds |
| 47,370 |
|
| - |
|
| 47,370 |
|
| - |
| ||||
John A. Stall |
| - |
|
| - |
|
| - |
|
| - |
| ||||
Lynn M. Utter |
| - |
|
| 4,678 |
|
| 4,678 |
|
| 2,307 |
| ||||
Darryl L. Wilson |
| 12,645 |
|
| - |
|
| 12,645 |
|
| 949 |
| ||||
All directors and executive officers as a group (24 persons) |
| 3,137,301 |
|
| 5,375,165 |
|
| 8,512,466 |
|
| 1,802,048 |
| ||||
(1) Includes shares of restricted stock (performance-based for executive officers) for Messrs. Ketchum (57,867), Crews (18,202), Pimentel (36,807) and Sieving (25,493), Mrs. Kujawa (65,684), as well as for Mrs. Barrat (31,200) and Mr. Camaren (12,800), and a total of 358,813 shares of restricted stock for all | |||||||||||||||||||||||||||||||||||||||||||||||||||||||||||||||||||||||||||||||||||||||||||||||||||||||||||||||||||||||||||||||||||||||||||||||||||||||||||||||||||||||||||||||||||||||||||||||||||||||||||||||||||||||||||||||||||||||||||||||||||||||||||||||||||||||||||||||||||||||||||||||||||||||||||||||||||||||||||||||||||||||||||||||||||||||||||||||||||||||||||||||||||||||||||||||||||||||||||||||||||||||||||||||||||||||||||||||||||||||||||||||||||||||||||||||||||||||||||||||||||||||||||||||||||||||||||||||||||||||||||||||||||||||||||||
|
|
|
|
27
Delinquent Section 16(a) Reports
The Company’s directors and executive officers as a group. The holders of such shares of restricted stock have voting power, but not dispositive power.
“SERP.”
GUIDELINES/CODE OF ETHICS
In determining that Mr. Schupp is independent, the Board considered that a NextEra Energy subsidiary has employed Mr. Schupp’s son since 2011 in non-executive business roles, for a total compensation in 2021 of approximately $256,000.
Followingbelieves that the decision as to who should serve as chairman and as chief executive officer (“CEO”) and whether the offices should be combined or separate is properly the responsibility of the Board to be exercised from time to time in appropriate consideration of the Company’s then-existing characteristics or circumstances. In view of the Company’s operating record, including its role as a national leader in renewable energy generation, and the operational and financial opportunities and challenges faced by the Company, the Board’s judgment is that the functioning of the Board is generally best served by maintaining a structure of having one individual serve as both chairman and CEO. The Board believes that having a single person acting in the capacities of chairman and CEO promotes unified leadership and direction for the Board and executive management and allows for a single, clear focus for the chain of command to execute the Company’s strategic initiatives and business plans and to address its challenges. However, in certain circumstances, such as the transition of Mr. Robofrom one CEO to executive chairman and Mr. Ketchum to CEO in March 2022,another, the Board believes that it may be appropriate for the roles of NextEra Energy’sthe CEO and the chairman and CEO have beento be separated. As noted under Election of Directors, in order to promote an effective and orderly CEO succession and transition, effective on March 1, 2022, Mr. Robo became executive chairman of the Board and Mr. Ketchum succeeded Mr. Robo as the Company’s CEO. In accordance with the Governance Guidelines, which provide that the Company’s CEO will serve as a director, Mr. Ketchum was appointed to the Board on the effective date of his appointment as CEO.
28
The Board has an independent Lead Director selected by and from the independent directors (with strong consideration given to present and past committee chairs). The Lead Director serves a two-year term commencing on the date of the Company’s annual meeting of shareholders. Unless the independent directors determine otherwise due to particular circumstances, no director will serve as the Lead Director for more than one two-year term on a consecutive basis. Sherry S. Barrat currently serves as the Lead Director, having been appointed initially in May 2020.2020 and reappointed in May 2022 in order to promote an effective and orderly CEO succession and transition. Mrs. Barrat is not standing for re-election having reached retirement age. The independent directors willGovernance & Nominating Committee has recommended that the Board appoint a successorMs. Lane to succeed Mrs. Barrat as the Lead Director atupon Mrs. Barrat’s retirement on the meetingdate of the annual meeting, and the Board immediately followingwill act upon that recommendation no later than the 2022 annual meeting.
meeting date.
»
»
29
| | ![[MISSING IMAGE: tm2228016d1-bx_auditpn.gif]](https://capedge.com/proxy/DEF 14A/0001104659-24-041966/tm2228016d1-bx_auditpn.gif) | | | | ![[MISSING IMAGE: tm2228016d1-bx_fininvespn.gif]](https://capedge.com/proxy/DEF 14A/0001104659-24-041966/tm2228016d1-bx_fininvespn.gif) | | | | ![[MISSING IMAGE: tm2228016d1-bx_nuclearpn.gif]](https://capedge.com/proxy/DEF 14A/0001104659-24-041966/tm2228016d1-bx_nuclearpn.gif) | | | | ![[MISSING IMAGE: tm2228016d1-bx_compenpn.gif]](https://capedge.com/proxy/DEF 14A/0001104659-24-041966/tm2228016d1-bx_compenpn.gif) | | | | ![[MISSING IMAGE: ic_governancenomini-ko.gif]](https://capedge.com/proxy/DEF 14A/0001104659-24-041966/ic_governancenomini-ko.gif) | |
| | AUDIT COMMITTEE | | | | FINANCE & INVESTMENT COMMITTEE | | | | NUCLEAR COMMITTEE | | | | COMPENSATION COMMITTEE | | | | GOVERNANCE & NOMINATING COMMITTEE | |
» Oversees the integrity of the Company’s financial statements, the independent auditor’s qualifications and independence, the performance of the Company’s internal audit function and the Company’s accounting and financial reporting processes
» Oversees compliance with legal and regulatory requirements
» Discusses with management the Company’s policies with respect to risk assessment and risk management
» Reviews and discusses the Company’s major financial risk exposures and the steps management has taken to monitor and control those exposures
» Ensures that risks identified from time to time as major risks are reviewed by the Board or a Board committee | ||||||||||||||||||
| |
| » Reviews and monitors the Company’s financing plans
» Reviews and makes recommendations regarding the Company’s dividend policy
» Reviews risk management activities and exposures related to the Company’s energy trading and marketing operations
» Reviews the Company’s major insurance lines
» Oversees the risks associated with financing strategy, financial policies and the use of financial instruments, including derivatives | ||||||||||||||||
| |
| » Reviews the safety, reliability and quality of nuclear operations
» Reviews reports issued by external oversight groups
» Reviews the Company’s long-term strategies and plans related to its nuclear operations | ||||||||||||||||
| |
| » Oversees compensation-related risks, including annually reviewing management’s assessment of risks related to employee compensation programs
» Oversees the compensation risk mitigation practices and controls that the Company has in place | | | | » Oversees board composition, refreshment and diversity » Annual review of political contributions and trade association memberships » Provides political engagement oversight » Makes recommendations to the Board on the business of the Annual Meeting of Shareholders | |
7.
30
members are incorporated into Board processes and Board agenda topics. This annual self-evaluation process ensures that the Board periodically considers improvements to Board processes and procedures.
Director Meetings and Attendance
shareholders, except for Director Dunn who was unable to attend due to personal matters.
![[MISSING IMAGE: tm2228016d1-fc_committepn.jpg]](https://capedge.com/proxy/DEF 14A/0001104659-24-041966/tm2228016d1-fc_committepn.jpg)
| | AUDIT COMMITTEE | | | Meetings in 2023: 8 | | ||||
| | | | |||||||
|
|
| |||||||
Members » Naren K. Gursahaney(Chair) » Nicole S. Arnaboldi » Kenneth B. Dunn » Dev Stahlkopf » John
A. Stall » Darryl L. Wilson
| |
| Primary Responsibilities » Appoints the Company’s independent registered public accounting firm and approves all permitted services to be performed by the firm
» Reviews the independent registered public accounting firm’s qualifications, performance and independence
» Approves the engagement of any other registered public accounting firm engaged for the purpose of preparing or issuing an audit report or performing other audit, review or attest services
» Assists the Board in overseeing the integrity of the Company’s financial statements and compliance with legal and regulatory requirements
» Assists the Board in overseeing the performance of the Company’s internal audit function, the accounting and financial reporting processes of the Company and audits of the Company’s financial statements
» Establishes procedures for the receipt, retention and treatment of complaints and concerns received by the Company regarding accounting, internal accounting controls or auditing matters and the confidential, anonymous submission of concerns regarding questionable accounting or auditing matters |
| |||||
31
| | ||||||
| | Qualifications » All members are independent and financially literate under applicable NYSE and SEC requirements » Mr. Gursahaney is an audit committee financial expert under the definition provided by the SEC | | ||||
| | COMPENSATION COMMITTEE | | | Meetings in 2023: 6 | | |||
| | | | | |||||
Members » Kirk S. Hachigian (Chair) » Sherry S. Barrat » James L. Camaren
» Dev Stahlkopf » Darryl L. Wilson
| | | Primary
» Reviews and approves corporate goals and objectives relevant to the compensation of the CEO and the other executive officers
» Evaluates the performance of the CEO in light of those goals and objectives, approves the compensation of the CEO and the other executive officers, approves any compensation-related agreements for the CEO and the other executive officers and makes recommendations to the Board with respect to the non-employee directors’ compensation
» Oversees the preparation of the Compensation Discussion & Analysis section of this proxy statement and approves the Compensation Committee Report
» Reviews the results of the Company’s shareholder advisory vote on the compensation of the NEOs, makes recommendations to the Board with respect to incentive compensation plans and other equity-based plans and administers the Company’s annual and long-term incentive plans and non-employee directors stock plan
» Retains, and assesses the independence of, any outside compensation consultants engaged to assist in the evaluation of executive compensation |
| ||||
| | ||||||||
| | |||||||
| | GOVERNANCE & NOMINATING COMMITTEE | | | Meetings in 2023: 6 | | ||||||
| | | | | Members » Amy B. Lane (Chair) » Sherry S. Barrat » Naren K. Gursahaney » Kirk S. Hachigian » David L. Porges | | | Primary
» Reviews the size and composition of the Board, identifies and evaluates potential nominees for election to the Board and recommends candidates for all directorships to be elected by shareholders or appointed by the Board
» Reviews the Governance Guidelines, the Related Person Transactions Policy and the content of the Code of Business Conduct & Ethics and the Senior Code and recommends any proposed changes to the Board
» Oversees the evaluation of the Board
» Makes recommendations to the Board regarding the business of the annual meeting of shareholders, as well as with respect to shareholder proposals that may be considered at the annual meeting » Annual review of political contributions and trade association memberships |
| |||
32
| | ||||||
| | ||||||
| | |||||
| | FINANCE & INVESTMENT COMMITTEE | | | Meetings in 2023: 7 | | ||||||
| | | | | Members » David L. Porges (Chair) » Nicole S. Arnaboldi » James L. Camaren » Kenneth B. Dunn » Maria G. Henry » Amy B. Lane | | | Primary
» Reviews and monitors the Company’s financing plans
» Reviews and makes recommendations to the Board regarding the Company’s dividend policy
» Reviews the Company’s risk management activities and exposures related to its energy trading and marketing operations
» Reviews certain proposed capital expenditures
» Reviews the performance of the Company’s pension, nuclear decommissioning and other investment funds |
| |||
| | |||||||||||
| | ||||||||||
| | NUCLEAR COMMITTEE | | | Meetings in 2023: 4 | | | |||||||
| | | | | Members » John A. Stall (Chair) » John W. Ketchum | | | Primary
» Meets with senior members of the Company’s nuclear division
» Reviews the operation of the Company’s nuclear division and makes reports and recommendations to the Board with respect to such matters
» Reviews, among other matters, the safety, reliability and quality of the Company’s nuclear operations and the Company’s long-term strategies and plans for its nuclear operations | |
| ||||
| | Qualifications » Mr. Stall meets the NYSE standards for independence | | | | | ||||||||
| | EXECUTIVE COMMITTEE | | | Meetings in 2023: 0 | | | | | |||
| | | |||||||||
Members » John W. Ketchum (Chair) » Sherry S. Barrat » Naren K. Gursahaney » Kirk S. Hachigian » Amy B. Lane
» David L. Porges | | | Primary
» Provides an efficient means of considering such matters and taking such actions as may require the attention of the Board or the exercise of the Board’s powers or authorities when the Board is not in session | |
| ||||||
Consideration of Director Nominees
access shareholder nomineesAccess Shareholder Nomineesnomineenominee(s) satisfy the requirements in the Bylaws. Notice of proxy access director nominees for the 20232025 annual meeting of shareholders should be addressed to theto:
NextEra Energy, Inc.,
P.O. Box 14000
700 Universe Boulevard
Juno Beach, Florida 33408-0420
33
Other Shareholder Nominees
shareholder nominees
NextEra Energy, Inc.
P.O. Box 14000
700 Universe Boulevard
Juno Beach, Florida
22, 2025.
NextEra Energy, Inc.
P.O. Box 14000
700 Universe Boulevard
Juno Beach, Florida 33408-0420
»
34
»
NextEra Energy believes that the terms of the services described above are comparable to the terms that would be available to an unrelated third party under the same or similar circumstances.
35
During 2023, the adult brother-in-law of Mr. Michael Dunne, a Company officer, was a partner in the law firm of Kirkland & Ellis LLP (“Kirkland & Ellis”) and a Company subsidiary paid Kirkland & Ellis approximately $0.2 million for legal services in connection with real estate and environmental matters and legal disputes regarding transmission assets.
2023:
2023.
36
management have been prepared with integrity and objectivity and in conformity with generally accepted accounting principles and (2) the report of the independent registered public accounting firm with respect to such financial statements.
Naren K. Gursahaney, Chair
Kenneth B. Dunn
John L. Skolds
Lynn M. Utter
Darryl L. Wilson
| | | | | | | | | | ![[MISSING IMAGE: ph_kennethbdunn-bw.jpg]](https://capedge.com/proxy/DEF 14A/0001104659-24-041966/ph_kennethbdunn-bw.jpg) | | | | | | | | | | | | | |
| | Naren K. Gursahaney, Chair | | | | Nicole S. Arnaboldi | | | | Kenneth B. Dunn | | | | Dev Stahlkopf | | | | John A. Stall | | | | Darryl L. Wilson | |
TOUCHE
| 2021 | 2020 | |||||||
Audit Fees(1) | $ | 6,853,000 |
| $ | 6,710,000 |
| ||
Audit-Related Fees(2) |
| 4,169,000 |
|
| 3,778,000 |
| ||
Tax Fees(3) |
| 599,000 |
|
| 708,000 |
| ||
All Other Fees(4) |
| 102,000 |
|
| 17,000 |
| ||
Total Fees | $ | 11,723,000 |
| $ | 11,213,000 |
| ||
(1) Audit fees consist of fees billed for professional services rendered for the audit of NextEra Energy’s and FPL’s annual consolidated financial statements for the fiscal year, the reviews of the financial statements included in NextEra Energy’s and FPL’s Quarterly Reports | |||||||||||||||||||||||||||||||||||||||||||||||||||||||||||||||||||||||||||||||||||||||||||
|
|
|
Policy on Audit Committee Pre-ApprovalForm 10-Q filed during the fiscal year, the audit of Auditthe effectiveness of internal control over financial reporting, and Non-Audit Servicesthe issuance of Independent Registered Public Accounting Firm
comfort letters and consents.
37
earnings materials), the Audit Committee reviews a schedule of services and the estimated fees for those services for which Deloitte & Touche has been engaged since the prior Audit Committee meeting under existing pre-approvals. In 20212023 and 2020,2022, no services provided to NextEra Energy or FPL by Deloitte & Touche were approved by the Audit Committee after services were rendered pursuant to Rule 2-01(c)(7)(i)(C) of the SEC’s Regulation S-X (which provides a waiver of the otherwise applicable pre-approval requirement under certain conditions).
38
| | ![[MISSING IMAGE: ic_shareholder-pn.jpg]](https://capedge.com/proxy/DEF 14A/0001104659-24-041966/ic_shareholder-pn.jpg) | | | | ![[MISSING IMAGE: ic_directos-pn.jpg]](https://capedge.com/proxy/DEF 14A/0001104659-24-041966/ic_directos-pn.jpg) | | | | ![[MISSING IMAGE: ic_annual-pn.jpg]](https://capedge.com/proxy/DEF 14A/0001104659-24-041966/ic_annual-pn.jpg) | |
| | 1. SHAREHOLDER MEETINGS | | | | 2. DIRECTOR PARTICIPATION IN SHAREHOLDER MEETINGS | | | | 3. ANNUAL SUMMARY OF WHAT WE HEARD | |
| | We have made it a priority to hold regular shareholder meetings to ensure our shareholders have the opportunity to directly engage with our management team. These meetings serve as a platform for open dialogue, where you can voice your concerns, ask questions, and receive updates on our initiatives. This year we expanded our outreach specifically around compensation matters. | | | | We understand the importance of our directors being accessible to shareholders, and director participation allows for open and direct communication. This year, I participated in several of our meetings with our largest shareholders, and I truly benefitted from the engaging conversations I had. | | | | We have added a disclosure table summarizing what we heard during shareholder meetings, as well as our response to the feedback received. This additional disclosure begins on page 42 of this proxy statement, and we plan to include this in future proxy statements. | |
| | ![[MISSING IMAGE: ph_sherrysbarrat-bw.jpg]](https://capedge.com/proxy/DEF 14A/0001104659-24-041966/ph_sherrysbarrat-bw.jpg) | | | SHERRY S. BARRAT Lead Director | |
This Compensation Discussion and Analysis (also referred to as “CD&A”) explains our 20212023 executive compensation program for theour NEOs. TheOur executive compensation program for the Company’s NEOs generally applies to theour Company’s other executive officers.officers, as well. Please read this discussion and analysis together with the tables and related narrative about executive compensation which follow.
Highlights
Execution on Strategic Imperatives Aligned with
| | | | | ||
| | | | | ||
| | | | | ||
| | | | |
Discussion & Analysis.
| | ![[MISSING IMAGE: ph_johnketchum-bw.jpg]](https://capedge.com/proxy/DEF 14A/0001104659-24-041966/ph_johnketchum-bw.jpg) | | | | ![[MISSING IMAGE: ph_terrellkirkcrews-bwlr.jpg]](https://capedge.com/proxy/DEF 14A/0001104659-24-041966/ph_terrellkirkcrews-bwlr.jpg) | | | | ![[MISSING IMAGE: ph_rebeccajkujawa-bwlr.jpg]](https://capedge.com/proxy/DEF 14A/0001104659-24-041966/ph_rebeccajkujawa-bwlr.jpg) | |
| | JOHN W. KETCHUM | | | | TERRELL KIRK CREWS II | | | | REBECCA J. KUJAWA | |
| | Chairman, President and Chief Executive Officer, NextEra Energy and Chairman, FPL | | | | Executive Vice President, Finance and Chief Financial Officer, NextEra Energy and FPL | | | | President and Chief Executive Officer, NextEra Energy Resources | |
| | ![[MISSING IMAGE: ph_armandopimentel-bwlr.jpg]](https://capedge.com/proxy/DEF 14A/0001104659-24-041966/ph_armandopimentel-bwlr.jpg) | | | | ![[MISSING IMAGE: ph_charlessieving-bwlr.jpg]](https://capedge.com/proxy/DEF 14A/0001104659-24-041966/ph_charlessieving-bwlr.jpg) | |
| | ARMANDO PIMENTEL, JR. | | | | CHARLES E. SIEVING | |
| | President and Chief Executive Officer, FPL | | | | Executive Vice President, Chief Legal, Environmental and Federal Regulatory Affairs Officer, NextEra Energy and Executive Vice President, FPL | |
| | | 2023 was another pivotal year for the Company as we delivered strong performance across the spectrum of factors, both financial and non-financial. The execution on these key pillars contributed to both near and longer-term value for stakeholders, including: | | | |||
| | | | | | | | ![[MISSING IMAGE: ic_customers-pn.gif]](https://capedge.com/proxy/DEF 14A/0001104659-24-041966/ic_customers-pn.gif) | | ||
| | RECORD FINANCIAL RESULTS » We continued our long history of delivering outstanding results for shareholders reflected in our record financial performance (with respect to adjusted earnings and adjusted EPS) and operational excellence. | | | | CORPORATE RESPONSIBILITY » NextEra Energy continues to be recognized as a leader in corporate responsibility. In 2023, NextEra Energy was named by Fortune Magazine as the World’s Most Admired Electric & Gas Utility for the sixteenth time in the last seventeen years. In 2023, Newsweek named NextEra Energy to its list of America’s Most Responsible Companies. | | | | COMMITMENT TO CUSTOMERS AND COMMUNITY » FPL’s smart grid technology avoided nearly 70,000 outages during Hurricane Idalia. With multiple years of reliability and storm hardening investments designed to limit physical risk, FPL did not lose a single transmission structure during Hurricane Idalia. | |
| | NET INCOME ATTRIBUTABLE TO NEXTERA ENERGY ON A GAAP BASIS | | | | ADJUSTED EARNINGS* | | | | ADJUSTED EPS* | |
| | ![[MISSING IMAGE: ic_netincome-pn.gif]](https://capedge.com/proxy/DEF 14A/0001104659-24-041966/ic_netincome-pn.gif) | | | | | | | ![[MISSING IMAGE: ic_adjustedeps-pn.gif]](https://capedge.com/proxy/DEF 14A/0001104659-24-041966/ic_adjustedeps-pn.gif) | | |
| | $7.310 B or $3.60 per share | | | | $6.441 B a company record | | | | $3.17 a company record | |
| | Metric | | | Data | | | Detail | | |||
| | Adjusted EPS Growth (1-year)* | | | | | 9.3% | | | | 2022-2023 YoY Growth | |
| | Adjusted EPS Growth (3-year)* | | | | | 11.1% | | | | 2021-2023 Average | |
| | Adjusted ROE (1-year)* | | | | | 15.0% | | | | 2023 Return on Equity | |
| | Adjusted ROE (3-year)* | | | | | 14.8% | | | | 2021-2023 Average | |
our peer group as measured for the purposes of our compensation programs. These significant accomplishments came as the CompanyNextEra Energy also continued to be a leader among the ten largest U.S. utilities (based on market capitalization**) in many financial metrics, asincluding those shown below.
Ten Largest
| | Metric | | | Rank | | | Detail | | |||
| | Adjusted EPS Growth* | | | | | #1 | | | | 3-, 5-, 7- and 10-year | |
| | Adjusted ROE* | | | | | #1 | | | | 1-, 3-, 5-, 7- and 10-year | |

In 2022, NextEra Energycapitalization is as of December 31, 2023; rankings are sourced from FactSet Research Systems Inc.
|
|
39
The returns that NextEra Energy generated for its shareholders were attributable to outstanding 2021 performance by the Company’s two principal operating businesses, FPL and NextEra Energy Resources. Some of the Company’s many operational and financial achievements in 2021 include:
| | FPL | | | | NEXTERA ENERGY RESOURCES | |
| | ||||||
Exceeded top-decile performance in minutes of service unavailability per customer and best-ever performance in frequency of | |
| | Added approximately 9,000 MWs of | | |
| | ||||||
Delivered best-in-class performance in | | | | Delivered strong performance in wind development, with approximately | | |
| | ||||||
The Edison Electric Institute (EEI) honored FPL, for the 22nd time, with its Emergency Response Award for the company’s power restoration efforts following Hurricane Idalia | | | | Delivered strong performance in solar development, with adding | | |
| | ||||||
In 2023 won the | | | | Leader in the U.S. in grid-scale battery storage, adding | | |
| | | |||||
| | | Achieved |
| ||
40
Ultimately,NextEra Energy has delivered superior company performance over multi-year cycles, driven in large part by an enduring executive compensation program that aligns with the Company’s superiorstrong pay for performance philosophy. Our program incentivizes our executives through the application of both annual and multi-year operational and financial performance measures, as well as through the application of a multi-year relative TSR performance measure. The structure is intended to drive consistent performance over the long-term in an industry such as ours, where large capital investment decisions for infrastructure projects which, if developed well over a generally long development cycle and operational performance is reflectedsubsequently operated well year-in and year-out, should provide positive, growing returns over extended periods. The structure also acknowledges the historically longer-term economic cycles inherent in the increased valuepower industry and the sporadic volatility that the power industry experiences from time-to-time.
| | NEXTERA ENERGY VS. INDICES | | | 1-YEAR TSR | | | 3-YEAR TSR | | | 5-YEAR TSR | | | 7-YEAR TSR | | | 10-YEAR TSR | | |||||||||||||||
| | NextEra Energy | | | | | (25.3)% | | | | | | (15.7)% | | | | | | 56.4% | | | | | | 140.2% | | | | | | 266.6% | | |
| | S&P 500 Index | | | | | 26.3% | | | | | | 33.1% | | | | | | 107.2% | | | | | | 141.4% | | | | | | 211.5% | | |
| | S&P 500 Growth Index | | | | | 30.0% | | | | | | 21.2% | | | | | | 112.1% | | | | | | 170.2% | | | | | | 250.2% | | |
| | S&P 500 Utilities Index | | | | | (7.1)% | | | | | | 11.0% | | | | | | 41.0% | | | | | | 64.5% | | | | | | 134.8% | | |
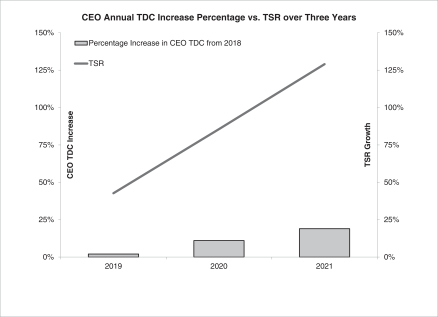
Ourthose indices demonstrates that our executive compensation program is designedincentivizing management to tie compensationmake decisions that deliver long-term value to shareholders relative to some of the highest-performing companies in the world. Our TSR over the 5-, 7- and 10-year time frame continues to compare favorably to the selected indices, while our 1- and 3-year TSR results trailed these indices, despite strong performance with someon ROE and EPS growth.
41
Compensation Elements Designed to Align with Our Strategy
Our executive compensation program is designed to attract, retain, motivate, reward and develop high-quality, high-performing executive leadership whose talent and expertise should increase the prospects of the NEOs in recognition of the stock price performance during 2023.
| | | | | Metric | | | Result | | | Payout Factor | |
| | Financial | | | Adjusted ROE | | | 15.0% | | | 2.00 | |
| | Adjusted EPS Growth | | | 9.3% | | ||||||
| | Operational | | | Metrics for FPL and NEER that focus on safety, customer value, reliability, operational excellence, and growth | | | FPL: 1.78 (50% weighting) NEER: 1.57 (50% weighting) | | | 1.68 | |
| | | | | | | | Total annual incentive as percent of target | | | 184% | |
| | | | | Metric | | | Payout Factor | |
| | Financial (80%) | | | 3-year Adjusted ROE and Adjusted EPS Growth | | | 2.00 | |
| | Operational (20%) | | | Four measures focused on safety, nuclear industry performance, outage rate, and service reliability | | | 1.98 | |
| | TSR Modifier (+/- 20%) | | | Relative 3-year TSR against top ten power companies by market capitalization | | | 80% | |
| | | | | Total 2021-2023 Performance Share Award Payout | | | 160% | |
![[MISSING IMAGE: bc_adjustedeps-pn.jpg]](https://capedge.com/proxy/DEF 14A/0001104659-24-041966/bc_adjustedeps-pn.jpg)
As discussed in more detail below, NEO direct compensation has three principal elements: base salary, annual incentive awards and equity compensation.
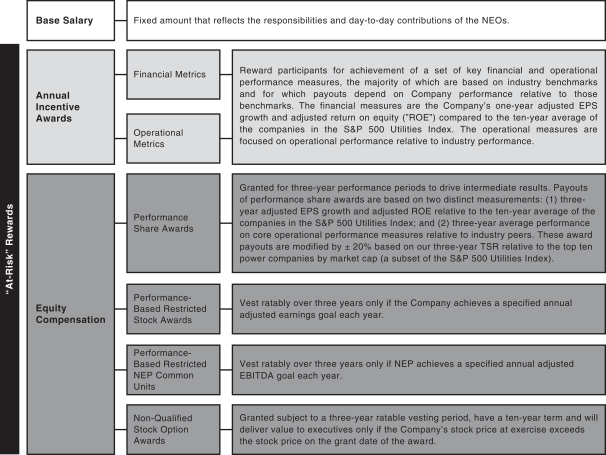
The Compensation Committee believes these core elements fulfillpeer group as measured for the fundamental objectivepurposes of our compensation programprograms.
42
Key Practices of Our Compensation Program Align Executive and Shareholder Interests
|
|
|
|
|
|
|
|
Responding to Our Shareholders – 2021 Say-On-Pay Vote and Shareholder Outreach
In 2021,Following our 2023 annual meeting, we held our eleventh annual advisory votereached out to approve NEO compensation, commonly known as “say-on-pay.” In 2021, we sought to engage with shareholders who, in the aggregate, represented a significant percentageapproximately 58.3% of our outstanding shares, and held discussions with those who agreed to our request for engagement.engagement, representing approximately 36.3% of our outstanding shares. Our engagement efforts are discussedLead Director participated in more detail8 meetings with our largest shareholders and brought insights back to the Compensation Committee and full Board.
Shareholdersfeedback from those engagements, we found shareholders were, consistent with our 2023 Say-on-Pay vote of 78.7% in favor, generally supportive of our executive compensation program and of our overall corporate governance practices. PriorA summary of what we heard during these discussions, as well as our responses to making determinations about 2022 NEO total compensation opportunities, the Compensation Committee reviewed the results of the 2021 say-on-pay vote, noting that 92.3% of those voting had voted “FOR” the Company’s compensation of its NEOs. The Compensation Committee considered this vote to be supportive of the Company’s executive compensation program.
43
Our Commitment to Best Practices
| | | | | ![[MISSING IMAGE: pc_52commonshare-pn.gif]](https://capedge.com/proxy/DEF 14A/0001104659-24-041966/pc_52commonshare-pn.gif) | | | | | | | ![[MISSING IMAGE: pc_38commonshare-pn.gif]](https://capedge.com/proxy/DEF 14A/0001104659-24-041966/pc_38commonshare-pn.gif) | | ||
| | 73 of our largest 100 shareholders contacted | | | | ~58.3% common shares outstanding contacted | | | | 22 shareholder meetings held | | | | ~36.3% common shares outstanding represented in meetings | |
| | WHAT WE HEARD | | | OUR RESPONSE | | ||||||||||
| | Shareholders wanted disclosure of the annual incentive plan metrics | | » Disclosure of the metric definitions and the rationale behind the metric selection has been expanded. The individual weightings for each metric are now disclosed, which offers a more comprehensive understanding of the calculations behind the final payouts. | ||||||||||||
| | Shareholders were proponents of higher annual performance metric hurdles for our NEE and NEP performance-based restricted stock awards | | | » The Compensation Committee increased the annual NEE performance-based stock award hurdle of adjusted earnings from $2.5B in 2023 to $3.0B for 2024 and the annual NEP performance-based stock award hurdle of adjusted EBITDA was increased from $400MM in 2023 to $900MM for 2024. We remain committed to evaluating the performance hurdles on an annual basis. | | ||||||||||
 | Shareholders commented that unvested equity should not count in stock ownership guidelines | | | » Our Governance & Nominating committee recommended that the full Board modernize the stock ownership guidelines to exclude unvested equity from counting towards the stock ownership guidelines. This update was approved in late 2023 and the plan details are available at www.investor.nexteraenergy.com/corporate-governance. | | ||||||||||
| | Shareholders prefer more robust anti-pledging policies | | | » Our Governance & Nominating committee recommended that the full Board modernize NEE’s Securities Trading Policy to implement a more robust anti-pledging policy that is consistent with best practices. This update was approved in late 2023 and the plan details are available within the Securities Trading Policy at www.investor.nexteraenergy.com/corporate-governance. | | ||||||||||
| | Shareholders expressed an interest in disclosure that incorporates the feedback we received during shareholder engagement meetings | | | » Beginning with this proxy statement, we are including this additional disclosure table which includes feedback related to our governance and executive compensation programs received during shareholder engagement meetings. We plan to include this information in future years as well. | | ||||||||||
| | WHAT WE HEARD | | | OUR RESPONSE | | |||||||||
| | Some shareholders indicated they preferred performance-based stock awards to have a minimum three-year cliff vesting period | | | » Both the NEE and NEP performance-based stock awards have one-year performance hurdles that must be achieved annually for the award to vest. We use one-year performance measurements for these long-term equity awards to emphasize the importance of the immediate responsibilities of our executives in attaining one-year goals that can act as a steppingstone towards long-term financial success. Per the NextEra Energy Stock Retention policy, once vested, all Section 16 officers are required to hold the stock for two additional years. Measuring performance annually but requiring executives to hold their awards for two years after vesting strikes a balance between immediate performance and sustainable value creation. It encourages behaviors that contribute to short-term goals and yet encourages a mindset geared towards the long-term success and sustainability of NextEra Energy. The table below illustrates the timeline of vesting versus when shares are available: | | |||||||||
| | | | | | | | Vesting Period | | | Post-Vest Holding Period | | | Shares Available (after grant) | |
| | | | | First (1/3) | | | 1 year | | | 2 years | | | 3 years | |
| | | | | Second (1/3) | | | 2 years | | | 2 years | | | 4 years | |
| | | | | Third (1/3) | | | 3 years | | | 2 years | | | 5 years | |
| | A few shareholders commented that similar metrics exist in the short- and long-term incentive plans | | | » While a financial matrix of adjusted ROE and adjusted EPS is utilized in both the short-term incentive and long-term incentive plans, the plans measure adjusted ROE and adjusted EPS over different time periods (1-year vs 3-year) and assign different weightings to the financial matrix. These metrics were selected due to their importance in aligning each program with shareholder interests. Since annual growth of adjusted EPS and consistently strong adjusted ROE are essential to supporting long-term financial growth, the Compensation Committee believes including these metrics in both plans supports the Company’s delivery of its long-term financial goals for our shareholders and our customers. | | |||||||||
| | We heard shareholders wanted compensation to reflect the shareholder experience in 2023 | | | » For 2024, we kept all target compensation, including base salaries, flat for all of the NEOs, notwithstanding record results on adjusted earnings and adjusted EPS. | | |||||||||
| | Shareholders generally disfavor single trigger change in control provisions | | | » Beginning in 2021, our executive change in control agreements were modernized with double trigger change in control (CIC) provisions. We committed to not provide single trigger CIC provisions to any newly hired or promoted executive officer, and only legacy agreements for certain current NEOs contain such provisions which provide vesting in connection with a CIC. | | |||||||||
| | | | | WHAT WE DO NOT DO | | ||
| | Tie pay to |  |
| ||||
 | Use industry benchmarks when setting operational goals and when reviewing actual performance and generally target top-decile |  |
| ||||
| Take steps to mitigate undue risk related to compensation, including using a clawback policy, stock ownership and retention requirements and multiple performance | |
| ||||
| Have robust stock ownership guidelines which all NEOs exceed | |
| ||||
| Require executive officers to hold both NEE and NEP performance-based restricted stock for two years after vesting | |
| ||||
| Have a minimum full vesting period for stock options and performance-based restricted stock, generally three years | |
| ||||
|
Use an independent compensation consultant | |
| ||||
| Engage in shareholder outreach and regularly assess the executive compensation program against shareholder input, emerging trends and other factors | |
| ||||
| Require NEOs to enter into Rule 10b5-1 plans with minimum waiting periods to transact trades in company securities | | | | No CEO employment agreement No tax gross-ups of NEO perquisites No excise tax gross-up provisions in change in control agreements entered into since 2009 No repricing of underwater stock options No share recycling under equity compensation plans No hedging or pledging of company securities by NEOs or directors permitted under securities trading policy No counting of unvested equity toward meeting stock ownership guidelines No guaranteed annual or multi-year bonuses | | |
2021 Named
CEO Succession
Effective March 1, 2022, the Company implemented its CEO successionlong-term incentives contribute to sustainability
Named Executive Officers
The table below provides our NEOs during 2021 whose compensation is described in this Compensation
Discussion & Analysis.
| | | | | CUSTOMER VALUE PROPOSITION | | | | | | | OPERATIONAL PERFORMANCE | | | | | | | SAFETY | | |||
| To emphasize the delivery of a sustainable, outstanding customer value proposition, compensation metrics include: » O&M costs per retail MWh, » capital expenditures, » service reliability, and » customer satisfaction scores. These metrics are intended to drive the sustainable delivery of: » low bills, » high reliability, » clean energy solutions, and » outstanding customer service. |
| | | Intended to support continued efficient and reliable delivery of These metrics include: » availability metrics across the generation fleets, and » reliability metrics for the transmission and distribution grid. | | | | Safety is a Company priority because people are our most important asset, and safety is a leading indicator of our operational performance. » The number of OSHA recordable incidents is included to emphasize the Company’s focus on a zero-injury workplace and incentivize senior executive leadership on safety issues. | | ||||||||||||
| | | | | ENVIRONMENTAL EVENTS | | |||||||||||||||||
| To support our commitment to the environment, metrics include: » achieving zero significant environmental violations across all of our businesses. |
| ||||||||||||||||||||
| | | Our executive compensation program is designed to attract, retain, motivate, reward and develop high-quality, high-performing executive leadership whose talent and expertise should increase the prospects of | | |
| | | | | | | | ELEMENT | | | HOW IT IS PAID | | | DESCRIPTION | | |||
| | ◀ FIXED ▶ | | | Short- Term | | | BASE SALARY | | | Cash | | | Fixed amount reflects the responsibilities and day-to-day contributions of the NEOs. | | |||
| ◀ “AT-RISK” REWARDS ▶ |
| | ANNUAL INCENTIVE AWARDS | | | Cash | | | Financial metrics » The financial measures are the Company’s one-year adjusted EPS growth and | | | Reward participants for achievement of a set of key financial and | | |||
| | Operational metrics » The operational measures are focused on operational performance relative to industry performance. | | |||||||||||||||
| Long- Term |
| | EQUITY COMPENSATION | | | Performance share awards | | | Granted for three-year performance periods to drive intermediate and 1. three-year adjusted EPS growth and adjusted ROE relative to the ten-year average of the companies in the S&P 500 Utilities Index, and 2. the average of annual performance on core operational performance measures relative to industry peers for each of three consecutive years. These award payouts are modified by ± 20% based on our three-year TSR relative to the top ten power companies by market cap (a subset of the S&P 500 Utilities Index). | | ||||||
| | Performance-based restricted stock awards | | | Vest ratably over three years only if the Company achieves a specified annual adjusted earnings goal each year. | | ||||||||||||
| Performance-based restricted NEP common units |
| | Vest ratably over three years only if NEP achieves a specified annual adjusted EBITDA goal each year. | | ||||||||||||
| | |||||||||||||||||
| |
| Granted subject to a three-year ratable vesting period, having a ten-year term and | | |||||||||||||
|
Our Target Pay Mix is Heavily Weighted Toward Performance
| | | | | 1. We set target total direct compensation opportunity and pay mix to support the goals of shareholder value creation and executive retention | | | | | | | 2. We link NEO financial success to shareholder value creation. | | ||
| | » Each NEO’s 2023 target compensation opportunity was set with reference to two benchmarking groups: energy services and general industry. These groups represent the broad, competitive labor market from which we recruit and compete for executive talent. This target opportunity is allocated over several forms of compensation, the mix of which supports shareholder value creation and executive retention. | | | | » All NEOs’ 2023 compensation included a significant element of equity compensation, supported by: • robust stock ownership guidelines, • performance hurdles, • vesting schedules, and • the potential for clawback. | | ||||||||
| | | | | 3. We value and review our performance relative to our competitors and peers whenever possible, rather than relative to arbitrary goals. | | | | | | | 4. We select compensation metrics linked to our long-term success; our principal financial metrics in 2023 were adjusted ROE and adjusted EPS growth. | | ||
| | » The basic principle underlying the linkage between our financial and operational performance and executive compensation is superior relative performance will result in above-target compensation, while inferior relative performance will generally result in below-target compensation. Wherever comparable information was available, our 2023 financial and operational performance was measured relative to industry performance. | | | | » Our 2023 plan measures adjusted ROE and adjusted EPS growth compared to the S&P 500 Utilities Index over a ten-year period. The Compensation Committee believes these financial metrics: • are objective, • require superior performance, • are aligned with creating shareholder value, and • encourage stretch goals. The Compensation Committee believes a ten-year period is appropriate due to the historically longer-term economic cycles inherent in the power industry and the sporadic volatility the power industry experiences from time-to-time. The Compensation Committee accordingly believes a ten-year period reduces the likelihood, in any given year, that inappropriate metrics will be established as a result of short-term industry anomalies. | | ||||||||
| | | The Compensation Committee believes a significant portion of each NEO’s total direct compensation opportunity should be performance-based, reflecting both upside and downside potential. | | |
45
In determining performance-based compensation for 2021,2023, the Compensation Committee sought to focus the efforts of the NEOs on a balance of short-term, intermediate-term and long-term goals. In addition, the Compensation Committee considered the NEOs’ perception of the relative values of the various elements of compensation and sought input from the CEO and the Compensation Consultant.
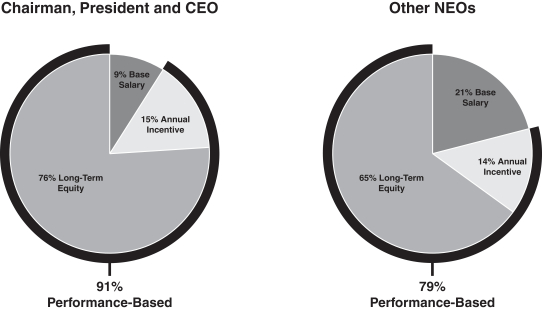
2021 Base Salary
CEO:
![[MISSING IMAGE: pc_ceoneo-pn.jpg]](https://capedge.com/proxy/DEF 14A/0001104659-24-041966/pc_ceoneo-pn.jpg)
| | | The Compensation Committee believes it is critical to the Company’s long-term performance to offer its executive officers compensation opportunities broadly commensurate with their competitive alternatives. | | |
| | | ENERGY SERVICES INDUSTRY | | | | | |||||
» Publicly traded company with a strong United States domestic presence » Classified with a Standard Industrial Classification (“SIC”) code similar to the Company’s SIC code » Annual revenue greater than $5 billion » A potential source of executive talent » Included in an executive compensation survey database provided by a third party | | | | » Publicly traded company with a strong United States domestic presence » Member of the S&P 500 » Considered highly reputable and highly regarded for operational excellence, product/service leadership or customer experience » Sustained revenues typically between 50% and 250% of the Company’s revenues » Consistently high performing | | | » Heavily industrialized, highly regulated or a producer of consumer staples » Operates in an industry which may be potential sources of executive talent » No unusual executive pay arrangements » Included in an executive compensation survey database provided by a third party » Contribute to diversity of industry representation in this segment of the peer group | | |||
| | | ENERGY SERVICES INDUSTRY (N=13) | | | | | |||||
» American Electric Power Company, Inc. | | | | » 3M Company | | | » General Dynamics Corporation | | |||
» Consolidated Edison, Inc. | | | | » Air Products and Chemicals, Inc. | | | » Halliburton Company | | |||
» Dominion Energy, Inc. | | | | » Caterpillar Inc. | | | » Honeywell International, Inc. | | |||
» Duke Energy Corporation | | | | » CIGNA Corporation | | | » Illinois Tool Works Inc. | | |||
» Edison International | | | | » Danaher Corporation | | | » Marsh & McLennan Companies, Inc. | | |||
» Entergy Corporation | | | | » Deere & Company | | | » Northrop Grumman Corporation | | |||
» Exelon Corporation | | | | » Devon Energy Corporation | | | » Schlumberger Limited | | |||
» FirstEnergy Corp. | | | | » DuPont De Nemours, Inc. | | | » Texas Instruments Incorporated | | |||
» PPL Corporation | | | | » Eaton Corporation | | | » Thermo Fisher Scientific, Inc. | | |||
» Public Service Enterprise Group Incorporated | | | | » Emerson Electric Co. | | | » Union Pacific Corporation | | |||
» Sempra Energy | | | | | | | | | |||
» The Southern Company | | | | | | | | | |||
» Xcel Energy Inc. | | | | | | | | | |||
| | WHAT WE USE | | | HOW WE USE IT | |
| | “Tally sheets” and “walk-away charts” | | | » Provides a check to ensure the Compensation Committee sees the full value of all elements of the NEOs’ annual compensation, both as opportunity and as actually realized, and sees the actual results of its compensation decisions in the various situations under which employment may terminate | |
| | Reviews by the CEO | | | » Prior to the beginning of the year, the Compensation Committee solicits performance reviews of the other NEOs and executive officers from the CEO for use as an additional input to the Compensation Committee’s determination of target total direct compensation opportunity and, after the end of the year, whether or not to use their discretion to adjust annual incentive compensation amounts determined using the formula discussed on page 58 | |
Other NEOs: Mrs. Kujawa’s salary in 2021 of $875,000 represented a 27% increase, Mr. Ketchum’s base salary of $1,400,000 represented a 19% increase, Mr. Silagy’s base salary of $1,400,000 represented a 7% increase, and Mr. Sieving’s base salary of $1,082,600 remained the same and his increase was applied entirely to performance-based elements of pay to align with the Company’s pay-for-performance philosophy.
46
2021 Annual Performance-Based IncentiveCHANGE IN NEO BASE SALARY
| | NAMED EXECUTIVE OFFICER | | | 2022 BASE SALARY ($) | | | 2023 BASE SALARY ($) | | | Percentage Increase % | | ||||||
| | John W. Ketchum | | | | | 1,500,000 | | | | | | 1,575,000 | | | | 5% | |
| | Terrell Kirk Crews II | | | | | 635,000 | | | | | | 730,300 | | | | 15% | |
| | Rebecca J. Kujawa | | | | | 1,000,000 | | | | | | 1,100,000 | | | | 10% | |
| | Armando Pimentel, Jr.(1) | | | | | — | | | | | | 1,000,000 | | | | — | |
| | Charles E. Sieving | | | | | 1,190,900 | | | | | | 1,274,000 | | | | 7% | |
Committee kept all target compensation, including base salaries, flat for 2024. This action acknowledges feedback from a limited number of shareholders indicating the desire for compensation to reflect the shareholder experience in 2023.
| | TYPE OF 2023 PERFORMANCE GOALS | | | HOW WE ESTABLISHED AND USED THE 2023 PERFORMANCE GOALS | |
| | |||||
FINANCIAL | |
| |||
| | |||||
|
» Based on enduring standards indicative of sustained
» Higher ratings indicate corporate financial performance superior to industry median and lower ratings indicate corporate financial performance which lags industry median. | | |||
| | |||||
OPERATIONAL | |
| » Goals and payout scales are established in advance of the year using available industry benchmarks insofar as possible.
» If an industry benchmark is not available, the applicable goal generally is set at a level representing an improvement or a stretch as compared to prior performance.
» As a general principle, the Compensation Committee seeks to set operational performance goals at levels that represent excellent performance, superior to the results of typical companies in our industry, and
» Performance on certain compliance-related goals is scored as either “met” or “not met,” while performance against other goals is judged on a sliding scale in comparison to top-decile, top-quartile, median and sub-median performance as compared to the industry. | |
47
2021 Financial Performance Matrix
The financial performance matrix approved by the Compensation Committee for 2021,2023, which is illustrated below, compares the Company’s 20212023 adjusted EPS growth and adjusted ROE to the average of the actual annual adjusted EPS growth and adjusted ROE of the companies included in the S&P 500 Utilities Index during the ten-year period from January 1, 20122014 to December 31, 20212023 (estimated for 20212023 using actual results for the first three quarters and analysts’ estimates for the fourth quarter).*
The Compensation Committee selected adjusted earnings because it provides a more meaningful representation of the Company’s fundamental earning power than net income calculated in accordance with GAAP and therefore better aligns the NEOs’ motivations with the Company’s strategy and with shareholders’ long-term interests. In addition, the Compensation Committee believes that the use of adjusted earnings for this purpose is consistent with the way in which the Company communicates its earnings to analysts and investors. Adjusted ROE is a long-term value creation metric that aligns the interest of management with those of our shareholders by measuring and rewarding profitability relative to shareholders’ investment. The Compensation Committee selected adjusted ROE because it is a gauge of our profitability and how efficiently we generate profits.
| | | | | ADJUSTED EARNINGS PER SHARE GROWTH | | | |
| | The Compensation Committee selected adjusted EPS growth because it provides a more meaningful representation of the Company’s fundamental earning power than net income calculated in accordance with GAAP and therefore better aligns the NEOs’ motivations with the Company’s strategy and with shareholders’ long-term interests. In addition, the Compensation Committee believes the use of adjusted EPS growth for this purpose is consistent with the way in which the Company communicates its earnings to analysts and investors. | | | ||||
| | | | | ADJUSTED ROE | | | |
| | Adjusted ROE is a long-term value creation metric that aligns the interest of management with those of our shareholders by measuring and rewarding profitability relative to shareholders’ investment. The Compensation Committee selected adjusted ROE because it is a gauge of our profitability and how efficiently we generate profits. | | | ||||
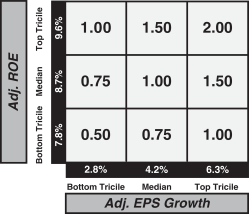
![[MISSING IMAGE: tbl_adjust-pn.jpg]](https://capedge.com/proxy/DEF 14A/0001104659-24-041966/tbl_adjust-pn.jpg) * Adjusted EPS growth and adjusted ROE which is used, among other reasons, to provide industry comparability, are not financial measurements calculated in accordance |
48
|
2021 Operational Goals
The Compensation Committee’s philosophy with respectGAAP and their definitions may differ among companies. Adjusted EPS growth, as defined by NextEra Energy for purposes of the annual Incentive Plan, is equal to the Company’s adjusted earnings dividend by weighted average diluted shares outstanding. Adjusted earnings, as defined by NextEra Energy for purposes of the Annual Incentive Plan, is the Company’s consolidated net income, as reported in the audited annual financial statements as determined in accordance with GAAP, excluding the effects of:
Our executive compensation program includes goals tied to ESG, a variety of which have been included as compensation metrics since 2001. For example, a portion of executive compensation is tied to completing the development and construction of our wind, solar and battery storage projects on schedule and on budget, as well as adding significant new wind, solar and battery storage opportunities to our backlog to support future growth. Implementing our renewables development strategy has led to significant emissions reductions benefiting our customers and the environment.
Other compensation metrics tied to ESG include: (1) customer value proposition – to emphasize the delivery of a sustainable, outstanding customer value proposition, compensation metrics include O&M costs per retail MWh, capital expenditures, service reliability and customer satisfaction scores; these metrics are intended to drive the delivery of low bills, high reliability, clean energy solutions and outstanding customer service; (2) operational performance – intended to support continued efficient and reliable delivery of clean energy to our customers, these metrics include availability metrics across the generation fleets and reliability metrics for the transmission and distribution grid; (3) safety – safety is a Company priority; the number of OSHA recordable incidents is included to emphasize the Company’s focus on a zero accident workplace; and (4) environmental events – to support our commitment to the environment, metrics include achieving zero significant environmental violations across all of our businesses.
49
The following tables set forth the 20212023 operational performance goals and the actual performance achieved against those goals.
FPL:
Indicator
|
Goal
|
Actual
|
Weight
| |||||
O&M costs (plan-adjusted)(1)
|
$1,311 million(1)
|
$1,338 million(1)
| 34% | |||||
Capital expenditures (plan-adjusted)(1)
|
$6,615 million(1)
|
$7,064 million(1)
| ||||||
Fossil generation availability(2) |
top decile performance
|
exceeded top decile performance
| 22% | |||||
Nuclear industry composite performance index(3)
|
aggressive goal
|
missed goal
| ||||||
Service reliability—service unavailability (minutes)
|
better than top decile (53.0 minutes)
|
best ever (48.8 minutes)
| ||||||
Service reliability—average frequency of customer interruptions
|
0.65 interruptions per customer per year (average)
|
0.57—best ever
| ||||||
Service reliability—average number of momentary interruptions per customer
|
4.7 momentary interruptions per customer per year
|
3.9—best-ever performance and top decile performance
| ||||||
Employee safety—OSHA recordables(4) per 200,000 hours
|
0.39—top decile
|
0.30—beat goal and exceeded top decile performance
| 19% | |||||
Significant environmental violations
|
0
|
0
| ||||||
Customer satisfaction—residential value surveys
|
aggressive goal
|
beat goal
| ||||||
Customer satisfaction—business value surveys
|
aggressive goal
|
beat goal
| ||||||
Performance under FERC and NERC reliability standards(5)
|
no significant violations
|
no significant violations
| ||||||
Successful completion of the base rate proceeding
|
fair outcome for customers and shareholders
|
fair outcome for customers and shareholders
| 25% | |||||
50
| | FPL | | | |||||||||||||||||
| | | | | INDICATOR | | | GOAL | | | ACTUAL | | | INDICATOR WEIGHT | | | TOTAL SECTION WEIGHT | | | ||
| | Customer Value | | | O&M costs (plan-adjusted)(1) | | | $1,325 million(1) | | | $1,323 million(1) exceeded top decile | | | 35% | | | ![[MISSING IMAGE: tm2228016d1-pc_50weightpn.jpg]](https://capedge.com/proxy/DEF 14A/0001104659-24-041966/tm2228016d1-pc_50weightpn.jpg) | | | ||
| | Capital expenditures (plan-adjusted)(1) | | | $8,837 million(1) | | | $9,528 million(1) | | | 15% | | | ||||||||
| | Reliability | | | Fossil generation availability(2) | | | top decile performance | | | exceeded top decile performance | | | 6% | | | ![[MISSING IMAGE: tm2228016d1-pc_30weightpn.jpg]](https://capedge.com/proxy/DEF 14A/0001104659-24-041966/tm2228016d1-pc_30weightpn.jpg) | | | ||
| | Nuclear industry composite performance index(3) | | | aggressive goal | | | beat goal and approximated top decile performance | | | 6% | | | ||||||||
| | Service reliability — service unavailability (minutes) | | | better than top decile (49.0 minutes) | | | exceeded top decile performance (46.7 minutes) | | | 7% | | | ||||||||
| | Service reliability — average frequency of customer interruptions | | | 0.62 interruptions per customer per year (average) | | | 0.55 — exceeded top decile performance | | | 7% | | | ||||||||
| | Service reliability — average number of momentary interruptions per customer | | | 4.2 momentary interruptions per customer per year | | | 3.3 — best ever performance and exceeded top decile performance | | | 4% | | | ||||||||
| | Operational | | | Employee safety — OSHA recordables(4) per 200,000 hours | | | 0.33 — top decile | | | 0.28 — exceeded top decile performance | | | 8% | | | ![[MISSING IMAGE: tm2228016d1-pc_20weightpn.jpg]](https://capedge.com/proxy/DEF 14A/0001104659-24-041966/tm2228016d1-pc_20weightpn.jpg) | | | ||
| | Significant environmental violations | | | 0 | | | 0 | | | 2% | | | ||||||||
| | Customer satisfaction — residential value surveys | | | aggressive goal | | | missed goal | | | 4% | | | ||||||||
| | Customer satisfaction — business value surveys | | | aggressive goal | | | missed goal | | | 4% | | | ||||||||
| | Performance under FERC and NERC reliability standards(5) | | | no significant violations | | | did not meet goal | | | 2% | | | | | ||||||
Indicator
|
Goal
|
Actual
|
Weight
| |||||
Earnings (plan-adjusted)(1)
|
$2,188 million(1)
|
$2,206 million(1)
| 52% | |||||
ROE
|
14.7%
|
15.1%
| ||||||
Meet budgeted cost goals
|
$2,082 million
|
$2,078 million
| ||||||
NEP Cash Available for Distribution
|
$640 million
|
beat goal
| ||||||
Employee safety—OSHA recordables(4) per 200,000 hours
|
0.39—top decile
|
0.26—beat goal and exceeded top decile performance
| 18% | |||||
Significant environmental violations
|
0
|
0
| ||||||
Nuclear industry composite performance index(3)
|
aggressive goal
|
beat goal and exceeded top decile performance | ||||||
Equivalent forced outage rate(6)
|
aggressive goal
|
beat goal and exceeded top decile | ||||||
Execute approved North American new and repowered wind projects on schedule and on budget
|
2,175 MW
|
beat goal
| 30% | |||||
Execute approved North American solar and storage projects on schedule and on budget
|
2,296 MW
|
missed goal
| ||||||
New development or acquisition opportunities within NextEra Energy Resources that receive approval
|
aggressive goal
|
beat goal
| ||||||
Pre-tax income contribution from all asset optimization, marketing and trading activities, full requirements and retail
|
aggressive goal
|
missed goal
| ||||||
| | NEXTERA ENERGY RESOURCES | | |||||||||||||||
| | | | | INDICATOR | | | GOAL | | | ACTUAL | | | INDICATOR WEIGHT | | | TOTAL SECTION WEIGHT | |
| | FINANCIAL | | | Earnings (plan-adjusted)(1) | | | $2,763 million(1) | | | $2,757 million(1) | | | 25% | | | ![[MISSING IMAGE: tm2228016d1-pc_52weightpn.jpg]](https://capedge.com/proxy/DEF 14A/0001104659-24-041966/tm2228016d1-pc_52weightpn.jpg) | |
| | ROE | | | 14.9% | | | 14.7% | | | 10% | | ||||||
| | Meet budgeted cost goals | | | $2,690 million | | | $2,747 million | | | 7% | | ||||||
| | NEP cash available for distribution | | | $815 million | | | missed goal | | | 10% | | ||||||
| | OPERATIONAL | | | Employee safety — OSHA recordables(4) per 200,000 hours | | | 0.33 — top decile | | | 0.18 — beat goal and exceeded top decile performance | | | 3% | | | ![[MISSING IMAGE: tm2228016d1-pc_18weightpn.jpg]](https://capedge.com/proxy/DEF 14A/0001104659-24-041966/tm2228016d1-pc_18weightpn.jpg) | |
| | Significant environmental violations | | | 0 | | | 0 | | | 2% | | ||||||
| | Nuclear industry composite performance index(3) | | | aggressive goal | | | beat goal and exceeded top decile performance | | | 5% | | ||||||
| | Equivalent forced outage rate(6) | | | aggressive goal | | | beat goal and exceeded top decile performance | | | 8% | | ||||||
| | GROWTH | | | Execute approved North American new and repowered wind projects on schedule and on budget | | | 1,700 MW | | | beat goal | | | 10% | | | ![[MISSING IMAGE: tm2228016d1-pc_30weightbw.jpg]](https://capedge.com/proxy/DEF 14A/0001104659-24-041966/tm2228016d1-pc_30weightbw.jpg) | |
| | Execute approved North American solar and storage projects on schedule and on budget | | | 3,800 MW | | | beat goal | | | 5% | | ||||||
| | New development or acquisition opportunities within NextEra Energy Resources that receive approval | | | aggressive goal | | | beat goal | | | 10% | | ||||||
| | Pre-tax income contribution from all asset optimization, marketing and trading activities, full requirements and retail | | | aggressive goal | | | beat goal | | | 5% | | ||||||
| | | Operational Performance Metrics | | | Description/Rationale | | | FPL Metric | | | NEER Metric | | |
| | Customer Value | | | Operations & maintenance costs (plan-adjusted) | | | Operations and maintenance costs play a crucial role in ensuring the efficient, reliable, and safe operation of our infrastructure while minimizing costs, ensuring customer satisfaction, and meeting regulatory requirements. Our best-in-class operations and maintenance costs ensure lower bills for our customers. | | | x | | | - | |
| | Capital expenditures (plan-adjusted) | | | By making strategic capital expenditures, we can deliver sustainable, reliable, efficient service while reducing long-term costs, staying competitive, and meeting regulatory requirements | | | x | | | - | | |||
| | Reliability/Operational | | | Fossil generation availability(2) | | | High availability rates evidence efficient operations, good management, and effective maintenance practices. We set our goal as exceeding the | | | x | | | - | |
|
| Nuclear industry composite performance index(3) | | | The “nuclear industry composite performance index” referenced is the Institute of Nuclear Power Operations, or INPO, index. INPO | | | x | | | x | | |
| | Service reliability—service unavailability (minutes) | | | The amount of downtime where power or other utility service was not provided due to outages or interruptions. We strive to minimize the number of minutes of service unavailability, as high availability rates are critical for customer satisfaction, operational efficiency and regulatory compliance. Our aggressive goal was set as exceeding the top decile performance level, as established by the 2022 Edison Electric Institute (EEI) survey results. | | | x | | | - | |
| | Service reliability—average frequency of customer interruptions | | | Represents how often, on average, a customer experiences an interruption in service during the year. By including this metric, we incentivize management to understand and track the causes of these interruptions, as well as develop strategies to minimize their occurrence, thus improving overall service reliability and customer satisfaction. Our aggressive goal was set as exceeding the top decile performance level, as established by the 2022 Edison Electric Institute (EEI) survey results. | | | x | | | - | |
| | Service reliability—average number of momentary interruptions per customer | | | The average number of momentary interruptions (brief outages of a few seconds to a few minutes) per customer is another measure of service reliability. | | | x | | | - | |
| | | Operational Performance Metrics | | | Description/Rationale | | | FPL Metric | | | NEER Metric | | |
| | Reliability/Operational | | | Employee safety—OSHA recordables per 200,000 hours(4) | | | OSHA recordables per 200,000 hours is a standardized safety evaluation metric where a lower rate indicates fewer recordable incidents in the | | | x | | | x | |
| | Significant environmental violations | | | We focus on eliminating significant environmental violations by setting the annual goal at zero such incidents—this demonstrates our commitment to sustainability, minimizing risks and preventing potential fines. | | | x | | | x | | |||
| | Customer satisfaction—residential value surveys | | | Including these metrics in executive compensation allows for a clear assessment of individual and overall organizational performance in meeting customer needs and expectations. Residential customer satisfaction is important to us, as reliable and affordable electricity is paramount for the overall well-being of our residential customers. | | | x | | | - | | |||
| | Customer satisfaction—business value surveys | | | Including business customer satisfaction as a metric in our compensation program encourages a culture of continuous improvement and innovation, which is important for us to support and contribute to the success and competitiveness of Florida’s business community. | | | x | | | - | | |||
| | Performance under FERC and NERC reliability standards(5) | | | We devote significant attention to consistently meeting these regulations which ensure grid reliability and well-functioning power markets. | | | x | | | - | | |||
| | Equivalent forced outage rate (EFOR)(6) | | | EFOR is an | | | - | | | x | | |||
| | Financial | | | Earnings (plan-adjusted, in MM)(1) | | | Strong earnings are essential for NEER as they reflect financial performance, contribute to investor confidence, support dividend payments, provide resources for growth and investment and facilitate debt servicing. Strong and sustainable earnings are critical for the success and long-term growth of the Company. | | | - | | | x | |
| | Return on equity | | | ROE measures our ability to generate profits from shareholders’ equity, making it a good measure of how efficiently management is using equity to generate profits and grow the company. High and sustainable ROE indicates effective long-term strategic planning and execution. | | | - | | | x | | |||
| | Meet budgeted cost goals (MM) | | | Meeting cost goals is essential as it drives profitability, enhances competitiveness, improves ROI, strengthens the customer value proposition, mitigates financial risks, drives operational efficiency, and supports sustainability efforts. It is a critical aspect of NEER’s overall business strategy and long-term success in the renewable energy sector. | | | - | | | x | | |||
| | NEP CAFD | | | Cash Available for Distribution, or | | | - | | | x | |
| | | Operational Performance Metrics | | | Description/Rationale | | | FPL Metric | | | NEER Metric | | |
| | Growth | | | Execute approved North American | | | Executing on the construction and fulfillment of previously approved wind projects supports growth, including EPS growth. | | | - | | | x | |
| | | Executing on the construction and fulfillment of previously approved solar projects supports growth, including EPS growth. | | | - | | | x | | |
| | New development or acquisition opportunities within NEER that receive approval | | | Growth of project backlogs gives visibility to future growth projects through focused capital investment for new, on-strategy growth opportunities. | | | - | | | x | |
| | PMI Growth: Pre-tax income contribution from all asset optimization, proprietary trading, origination, gas marketing and trading, full requirements net of G&A and Gexa | | | NextEra Energy Marketing is | | | - | | | x | |
51
After the end of 2021,2023, the Executive Compensation Review Board (“review board”), whose members were Messrs. Ketchum, RoboCrews and Silagy,Pimentel, Mrs. Kujawa, Mrs. Daggs and the executive vice president, human resources and corporate services,Ms. Caplan, assessed:
2021 Annual Incentive Awards
![[MISSING IMAGE: tm2228016d1-pc_neospn.jpg]](https://capedge.com/proxy/DEF 14A/0001104659-24-041966/tm2228016d1-pc_neospn.jpg)
1.84.
| | ![[MISSING IMAGE: ic_financko-pn.gif]](https://capedge.com/proxy/DEF 14A/0001104659-24-041966/ic_financko-pn.gif) | | | ![[MISSING IMAGE: ic_operatiko-pn.gif]](https://capedge.com/proxy/DEF 14A/0001104659-24-041966/ic_operatiko-pn.gif) | | | ![[MISSING IMAGE: ic_performance-bw.gif]](https://capedge.com/proxy/DEF 14A/0001104659-24-041966/ic_performance-bw.gif) | |
| | FINANCIAL PERFORMANCE (50%) | | | OPERATIONAL PERFORMANCE (50%) | | | OVERALL PERFORMANCE RATING | |
| | 2023 Adjusted EPS Growth: 9.3% | | | | | | | |
| | 2023 Adjusted ROE: 15.0% | | | | | | | |
| | 2.00 | | | 1.68 | | | 1.84 | |
The Compensation Committee determined the
NEOs.
Annual Incentive = (NextEra Energy Performance Rating x Individual Performance Factor) x Target Annual Incentive
![[MISSING IMAGE: tm2228016d1-fc_21neopn.jpg]](https://capedge.com/proxy/DEF 14A/0001104659-24-041966/tm2228016d1-fc_21neopn.jpg)
52
In years where the Company’s performance is above or substantially above the performance of its peers as evidenced byon industry benchmarks, as it was in 2021, the Company expects that annual incentive awards will be paid to the NEOs at a rate exceedingabove target. This was the target rate. For 2021,case in 2023, and the NEOs’ annual incentive awards were as follows:
Named Executive Officer
|
2021 Target Annual
|
2021 Annual Incentive
| ||||||
James L. Robo | $2,496,000 | $4,992,000 | ||||||
Rebecca J. Kujawa | $ 612,500 | $1,225,000 | ||||||
John W. Ketchum | $ 980,000 | $1,960,000 | ||||||
Eric E. Silagy | $ 980,000 | $1,960,000 | ||||||
Charles E. Sieving | $ 649,560 | $1,299,100 | ||||||
2021 Long-Term Performance-Based Equity Compensation
Equity Compensation Mix
| | NAMED EXECUTIVE OFFICER | | | 2023 Annual Incentive Target (as a % of Base Salary | | | 2023 TARGET ANNUAL INCENTIVE ($) | | | 2023 ANNUAL INCENTIVE AWARD ($) | | |||||||||
| | John W. Ketchum | | | | | 160% | | | | | | 2,520,000 | | | | | | 4,636,800 | | |
| | Terrell Kirk Crews II | | | | | 70% | | | | | | 511,200 | | | | | | 940,600 | | |
| | Rebecca J. Kujawa | | | | | 100% | | | | | | 1,100,000 | | | | | | 2,024,000 | | |
| | Armando Pimentel, Jr.(1) | | | | | 100% | | | | | | 1,000,000 | | | | | | 1,840,000 | | |
| | Charles E. Sieving | | | | | 70% | | | | | | 892,000 | | | | | | 1,641,300 | | |
| | WHAT WE GRANTED | | | WHY WE GRANTED IT | |
| | |||||
|
| ||||
Performance shares | | | » Directly focus NEOs on the multi-year sustained achievement of challenging TSR, financial and operational goals, because the number of shares ultimately earned depends upon the Company’s and the NEO’s performance over a three-year performance | | |
| | |||||
Performance-based restricted stock | | | » Includes a performance » Affected by all stock price changes, so value to NEOs affected by both increases and decreases in the Company’s stock » Require two-year post-vest hold | | |
| | |||||
Performance-based restricted NEP common units | | | » Includes a performance » Affected by all common unit price changes, so value to NEOs affected by both increases and decreases in NEP’s common unit » Require two-year post-vest hold | | |
| | |||||
Stock options | | | » Reward the NEOs only if the Company’s stock price increases and remains above the stock price on the date of | | |
| | | | | | | | | | | | ||||
| | » the mix of these components at competitor and peer companies and emerging market trends | | | | » the retention value of each element and other values important to the Company, including, for example, the tax and accounting consequences of each type of award | | | | » the advice of the Compensation Consultant | | | | » the perceived value to the NEO of each element | |
the mix of these components at competitor and peer companies and emerging market trends;
the retention value of each element and other values important to the Company, including, for example, the tax and accounting consequences of each type of award;
the advice of the Compensation Consultant; and
the perceived value to the NEO of each element.
As shown below, theThe Compensation Committee continued its practice of granting NEOs equity-based compensation, the majority of which is composed of a substantially greater percentage of performance share awards, since
53
awards. This practice aligns with feedback from our shareholders, who have indicated during our shareholder outreach that they favoredfavor the longer-term performance features of performance shares. After the Compensation Committee determined the appropriate mix of equity compensation components, theThe target award level for each equity-based element was expressed as a percentage of each NEO’s target total direct compensation opportunity. The target dollar value for each component was converted to a number of shares of equivalent value (estimated present value for stock options and performance shares).
2021 Mix of Equity Compensation Awards for the NEOs
NEOs:
Named Executive Officer
|
Mix of Equity Compensation Awards(1)
| |||||||||||||||||||
Performance Shares
| Options
| Performance-
|
Performance-
| |||||||||||||||||
James L. Robo | 65% | 25% | 3% | 7% | ||||||||||||||||
Rebecca J. Kujawa | 60% | 20% | 13% | 7% | ||||||||||||||||
John W. Ketchum | 60% | 20% | 13% | 7% | ||||||||||||||||
Eric E. Silagy | 60% | 20% | 20% | — | ||||||||||||||||
Charles E. Sieving | 60% | 20% | 13% | 7% | ||||||||||||||||
(1) Calculation of percentage mix based on | |||||||||||||||||||||||||||||||||||||||||||||||||||||||||||||||||||||||||||||||||||||||||||||||||||||||||||||||||||||||||||||||||||||||||||||||||||||||||||||||||||||||||
Performance Share Awards Granted in 2021 for the Performance Period Ending Decembertarget value of each grant as a percentage of each NEO’s total equity-based compensation.
DECEMBER 31,
For the2025
54
both in terms of the objectives and time-frames thanfrom the goals used to measure short-term performance under the Company’s Annual Incentive Plan. The measures and their relative weights are set forth below:
| | PERFORMANCE MEASURE | | | WEIGHT | | | TARGET | | ||||||
| | | | Financial measures: | | | | | | | | | | | |
|
|
| ||||||||||||
3-year TSR relative to top ten power companies by market capitalization, which is a subset of the S&P 500 Utilities Index | | | ±20% modifier to award payout | | | Midpoint of the TSR at the 75th and | | |||||||
| | ||||||||||||||
| | | | | ![[MISSING IMAGE: tm2228016d1-pc_fin80pn.jpg]](https://capedge.com/proxy/DEF 14A/0001104659-24-041966/tm2228016d1-pc_fin80pn.jpg) | | | ROE: 8.6% | ||||||
| | EPS: 4.0% | | ||||||||||||
| | | Operational measures:
| | | | | | Target Performance | | | | | |
| | 3-year average employee | | | | | ![[MISSING IMAGE: tm2228016d1-pc_ope97pn.jpg]](https://capedge.com/proxy/DEF 14A/0001104659-24-041966/tm2228016d1-pc_ope97pn.jpg) | | | 0.97 | | ||||
| Nuclear industry composite performance index (combined for FPL and NextEra Energy Resources nuclear facilities) | | | | | | ![[MISSING IMAGE: tm2228016d1-pc_fope93pn.jpg]](https://capedge.com/proxy/DEF 14A/0001104659-24-041966/tm2228016d1-pc_fope93pn.jpg) | | | 93.8 | | |||
| 3-year average equivalent forced outage rate (fossil and renewable generation) | | | | | | ![[MISSING IMAGE: tm2228016d1-pc_fope65pw.jpg]](https://capedge.com/proxy/DEF 14A/0001104659-24-041966/tm2228016d1-pc_fope65pw.jpg) | | | 6.5% | | |||
| FPL 3-year average service | | | | | | ![[MISSING IMAGE: tm2228016d1-pc_ope114pw.jpg]](https://capedge.com/proxy/DEF 14A/0001104659-24-041966/tm2228016d1-pc_ope114pw.jpg) | | | 114.0 | | |||
![[MISSING IMAGE: tbl_adjustroe-pn.jpg]](https://capedge.com/proxy/DEF 14A/0001104659-24-041966/tbl_adjustroe-pn.jpg)
Payout
Each NEO grant, was granted a target number of performance shares in 20192021 for a three-year performance period beginning January 1, 20192021 and ending on December 31, 2021.2023. The Compensation Committee views the payout of this grant after the end of the performance period as part of each NEO’s 20192021 compensation, while the performance shares granted in 20212023 for the performance period ending on December 31, 20232025 are considered to be part of each NEO’s 20212023 compensation, even though the shares will not be issued, if at all, until February 2024.
At2026.
| | | | | Relative TSR Percentile Ranking for 3-Year Performance Period | | | TSR Results for Three Year Performance Period | | | Modifier Result | | |||
| | NextEra Energy | | | | | | | | -13.25% | | | | 0.80 | |
| | Top Ten Power Companies by Market Capitalization (a subset of the S&P 500 Utilities Index) | | | 75th Percentile | | | | | 27.37% | | | | 120% | |
| | Midpoint | | | | | 13.99% | | | | Interpolated | | |||
| | 25th Percentile | | | | | -13.25% | | | | 80% | | |||
| | PERFORMANCE MEASURE(1) | | | WEIGHT | | | RESULT | | | PAYOUT AS A % OF TARGET | | |||||||||
| | Adjusted EPS growth and adjusted ROE | | | | | 80% | | | | | | 2.00 | | | | | | 200% | | |
| | Operational measures | | | | | 20% | | | | | | 1.98 | | | | | | 198% | | |
| | Overall rating | | | | | | | | | | | 2.00 | | | | | | 200% | | |
| | Relative TSR modifier | | | | | ±20% | | | | | | 0.80 | | | | | | 80% | | |
| | Overall rating (after applying relative TSR modifier and individual performance factors)(1) | | | | | | | | | | | 1.60 | | | | | | 160% | | |
Performance Measure(1)
|
Weight
|
Result
|
Payout as a % of Target
| ||||||||||||
Adjusted EPS Growth and Adjusted ROE | 80% | 2.00 | 200% | ||||||||||||
Operational Measures | 20% | 1.88 | 188% | ||||||||||||
Overall Rating | 1.98 | 198% | |||||||||||||
Relative TSR Modifier | ± | 20% | 1.20 | 120% | |||||||||||
Overall Rating (after applying relative TSR modifier and individual performance factors)(1) | 2.00 | 200% | |||||||||||||
|
55
Named Executive Officer
|
Target Performance Shares 1/1/19-12/31/21
| Performance Shares Earned
| ||
James L. Robo | 176,528 | 353,056 | ||
Rebecca J. Kujawa | 20,228 | 40,456 | ||
John W. Ketchum | 38,368 | 76,736 | ||
Eric E. Silagy | 49,580 | 99,160 | ||
Charles E. Sieving | 24,184 | 48,368 | ||
Performance-Based Restricted Stock Granted
| | NAMED EXECUTIVE OFFICER | | | TARGET PERFORMANCE SHARES FOR PERFORMANCE PERIOD 1/1/21-12/31/23 | | | PAYOUT FACTOR | | | PERFORMANCE SHARES EARNED | | |||||||||
| | John W. Ketchum | | | | | 37,433 | | | | | | 1.60 | | | | | | 59,892 | | |
| | Terrell Kirk Crews II(1) | | | | | 1,150 | | | | | | 1.91 | | | | | | 2,196 | | |
| | Rebecca J. Kujawa | | | | | 22,920 | | | | | | 1.60 | | | | | | 36,672 | | |
| | Armando Pimentel, Jr.(2) | | | | | — | | | | | | — | | | | | | — | | |
| | Charles E. Sieving | | | | | 16,478 | | | | | | 1.60 | | | | | | 26,364 | | |
performance share award as he was not employed by the Company at that time.
Performance-Based Restricted To ensure alignment between our senior executives and our shareholders, grants of performance-based restricted stock require a two-year post-vest hold.
COMMON UNITS GRANTED IN 2023
million (this was increased to $900 million for awards granted in 2024).
56
Non-Qualified Stock Option Awards in 2021
NONQUALIFIED STOCK OPTION AWARDS IN 2023
Executive Transition Awards of Performance-Based Restricted Stock Units in 2021
In consultation with its independent Compensation Consultant, the Compensation Committee granted a one-time executive transition equity award to each of the NEOs, other than the CEO, in February 2021. The Compensation Committee awarded performance-based restricted stock units to Mrs. Kujawa and Messrs. Ketchum, Silagy and Sieving as part of a strategy designed to preserve long-term business continuity among our leadership team during the CEO transition and beyond as discussed under CEO Succession and Executive Transitions. These transition awards provided 59,559 performance-based restricted stock units to each NEO above and will vest, subject to their continuous employment, over a 10-year period for Mrs. Kujawa and Messrs. Ketchum and Sieving, with 50% of the award vesting on February 15, 2026 and 50% of the award vesting on February 15, 2031, and over a 7-year period for Mr. Silagy, with 50% of the award vesting on February 15, 2025 and 50% of the award vesting on February 15, 2028.
The executive transition awards have no value to the NEO unless the Company meets a defined annual performance goal of $2.2 billion in adjusted earnings and he or she remains employed with the Company through the above vesting dates. The awards do not provide for pro rata vesting in connection with the NEOs’ retirement. In determining the award amounts, the Compensation Committee considered several factors including the competitive labor market for top talent and the Company’s desire to continue accomplishing its long-term continuous business growth strategy. The Compensation Committee believes that these executive transition awards are in the best interests of the Company and its shareholders and will further align the interests of these NEOs with those of shareholders over the next decade.
Equity Grant Practices
How We Make Compensation Decisions
Compensation Committee Role
The Compensation Committee plans its agendaspolicies related to ensure a thoroughcompensation
The Compensation Committee had an executive session at the end of each of its 2021 meetings, during which no executive officers were present. During the appropriate executive sessions, the Compensation Committee evaluated the performance of the chairman and CEO, discussed and approved the
57
compensation of the chairman and CEO, met with the Compensation Consultant and discussed and considered such other matters as it deemed appropriate including succession planning for key executive positions.
During 2021, the Compensation Committee engaged Frederic W. Cook & Co., Inc. (“FW Cook”), an independent executive compensation consulting firm which performed no other services for NextEra Energy or its affiliates, to provide advice and counsel to the Compensation Committee from time-to-time. FW Cook is sometimes referred to as the “Compensation Consultant.”
In 2021, the Compensation Consultant participated in all Compensation Committee meetings. In accordance with its engagement letter, during the 2021 executive compensation cycle, FW Cook provided the Compensation Committee and the Company with analyses and advice on topics such as pay competitiveness and executive compensation program plan design, including with respect to the executive transition awards. FW Cook also benchmarked and discussed with the Compensation Committee its recommendation with respect to non-employee director compensation. The Compensation Consultant also monitored current and emerging market trends and reported to the Compensation Committee on such trends and their impact on the Company’s compensation practices. In 2021, the Compensation Committee also assessed the independence of FW Cook in accordance with SEC rules and concluded that FW Cook’s work for the Compensation Committee did not raise any conflicts of interest.
Compensation Resources
The Compensation Committee used its business judgment to set each NEO’s target total direct compensation opportunity for 2021 and each compensation element. The Compensation Committee based its determination on its integrated assessment of a series of factors, including competitive alternatives, individual and team contribution and performance, corporate performance, complexity and importance of the role and responsibilities, experience, leadership and growth potential and the relationship of the NEO’s pay to the pay of NextEra Energy’s other executive officers. There are no material differences among NEOs with respect to the application of NextEra Energy’s compensation policies or the way in which total compensation opportunity is determined.
The Compensation Committee primarily used the following resources to aid in its determination of the 2021 target total direct compensation opportunity for each NEO.
Market Comparisons/Peer Group
When establishing each NEO’s target total direct compensation opportunity for 2021, the Compensation Committee considered the competitive market for comparable executives and compensation opportunities provided by comparable companies. Competition for executive talent primarily affects the aggregate level of the target total direct compensation opportunity available to the NEOs.
The Compensation Committee believes that it is critical to the Company’s long-term performance to offer its executive officers compensation opportunities broadly commensurate with their competitive alternatives. The Company obtained market comparison information for all NEOs from publicly-available peer group information. The Company’s peer group is composed of a set of companies from the energy services industry and a set of companies from general industry. These companies were selected by the Compensation Committee with input from executive officers (including the CEO) and the Compensation Consultant. The Compensation Committee believes that the use of companies from both the energy services industry and general industry was appropriate because the Company’s executive officers come from both within and outside the Company’s industry. NEOs were recruited from within and outside the Company’s industry and the Compensation Committee believes that their opportunities for alternative employment are not limited to other energy or utility companies.
58
For 2021, the Compensation Committee conducted a review of the then-existing 2020 peer group based on the following criteria:
| | | |||||
| ||||||
The Company believes it is important for executive officers to accumulate a significant amount of NextEra Energy |
| |||||
|
| | | |||
59
Based on its review, the Compensation Committee approved the removal of PG&E Corporation from the energy services peer group and the removal of Anadarko Petroleum Corporation (acquired) from, and the replacement of DowDuPont with DuPont De Nemours, Inc. (following the spin-off into three separate companies) in, the general industry peer group. The Compensation Committee believes the peer group is appropriately aligned with industries in which the Company competes for talent and the Company’s business in terms of market capitalization and scope. Thus, the executive compensation programs of the following companies were reviewed as market comparators for 2021:
|
| |
|
| |
|
| |
|
| |
|
| |
|
| |
|
| |
|
| |
|
| |
|
| |
|
| |
|
| |
|
| |
|
| |
Although the Compensation Committee did not target specific total compensation levels relative to industry peers (a so-called “percentile” approach), it generally reviewed peer company data at the 50th percentile for the general industry companies and the 75th percentile for the energy services industry companies. The Compensation Committee believes these levels were appropriate because:
the Company’s 2020 market capitalization and assets were above the 75th percentile of its general industry peer companies and its energy services industry peer companies;
|
the Company’s practice is to make a relatively high portion of each NEO’s compensation performance- based as compared to its peers; and
the Company’s operations are more complex, more diverse and of a greater size than those of substantially all of its energy services industry peer companies.
60
Other Resources
|
| |
|
| |
|
| |
Other Practices and Policies Related to Compensation
Stock Ownership and Retention Policies
The Company believes it is important for executive officers to accumulate a significant amount of NextEra Energy common stock to align officers’ interests with those of the Company’s shareholders. NextEra Energy’s NEOs (and all other officers) are subject to a stock ownership policy and a stock retention policy. The Company believes these policies strongly reinforce NextEra Energy’s executive compensation philosophy and objectives. At the same time, the Company recognizes that the accumulation of a large, undiversified position in NextEra Energy common stock can at some point create undesired incentives, and it permits its officers some degree of diversification once the target level of holdings is reached.
| | POSITION | | | STOCK OWNERSHIP REQUIREMENT, AS A MULTIPLE OF BASE SALARY RATE | | | | | | COMPLIANCE PERIOD | | | COMPLIANCE STATUS | |
| | CEO | | | | | 7x | | | Within five years after appointment to office | | | As of December 31, 2023, all NEOs owned common stock in excess of their requirements | | |
| Senior executive officers | | | | 3x | | ||||||||
| | ||||||||||||||
| | |||||||||||||
| | ||||||||||||||
| | | 1x | |
As of December 31, 2021, all NEOs owned common stock in excess of their requirements.
61
Officers who fail to comply with the retention policy may not be eligible for future equity-based compensation awards for a two-year period. The CEO may approve the modification or reduction of the minimum retention requirements (other than for himself) to address the special needs of a particular officer, although to date there have been no such modifications or reductions.
provisions
|
|
Board that an accounting restatement Company’s previously published financial statements is required due to material non-compliance by the Company with any financial reporting requirement under the federal securities laws, or that would result in a material misstatement if the error were corrected in the current period or left uncorrected in the current period or, if earlier, the date such a decision should have been made.
Anti-Hedging Policy
oversight
62
Additional 2021 Compensation Elements
Benefits
2023 compensation elements
Personal Benefits
Use of Company-Owned Aircraft
2023.
Policy on Tax Reimbursements on Executive Perquisites
2023.
63
reimbursements to executives as part of a plan, policy or arrangement applicable to a broad base of management employees of the Company, such as a relocation or expatriate tax equalization policy.
Post-Employment Compensation
control
64
Retention Agreements entered into since 2009 do not include excise tax gross-ups. Retention Agreements entered into since 2021 require double-trigger equity vesting upon a change of control; i.e., there must be both a change of control and
80.
Employee Pension Plan and 401(k) Plan
programs
Supplemental Executive Retirement Plan
Deferred Compensation Plan
considerations
65
flexibility in awarding compensation, even though some compensation awards may result in non-deductible compensation expenses, the Compensation Committee intends to maintain strong pay-for-performance alignment of executive compensation arrangements notwithstanding loss of deductibility due to repeal of the exemption for performance-based compensation.
2023.
Kirk S. Hachigian, Chair
Sherry S. Barrat
James L. Camaren
Amy B. Lane
Darryl L. Wilson
66
| | | | | | | | | | | | | | | | | | | |
| | Kirk S. Hachigian, Chair | | | | Sherry S. Barrat | | | | James L. Camaren | | | | Dev Stahlkopf | | | | Darryl L. Wilson | |
68●NEXTERA ENERGY 2024 PROXY STATEMENT
202
3 summary compensation table (A) (B) (C) (D) (E) (F) (G) (H) (I) (J)
POSITION YEAR
($) BONUS
($)
AWARDS
($)
AWARDS
($)
INCENTIVE PLAN
COMPENSATION
($)
PENSION VALUE
AND
NONQUALIFIED
DEFERRED
COMPENSATION
EARNINGS
($)
COMPENSATION
($) TOTAL
($)
Chairman, President and CEO
of NextEra Energy and
Chairman of FPL 2023 1,575,000 0 10,568,909 2,599,993 4,636,800 811,026 399,396 20,591,124 2022 1,483,333 0 8,436,431 2,187,500 4,500,000 475,209 331,856 17,414,329 2021 1,400,000 0 10,517,014 983,999 1,960,000 421,019 225,121 15,507,153
Executive Vice President, Finance and Chief Financial Officer of NextEra Energy and FPL 2023 730,300 0 2,048,115 391,691 940,600 204,299 103,552 4,418,556 2022 630,400 0 1,317,395 264,094 889,000 103,644 91,662 3,296,195
President and Chief Executive Officer of NextEra Energy Resources 2023 1,100,000 0 7,111,077 1,359,993 2,024,000 407,530 173,876 12,176,476 2022 979,167 0 5,487,265 1,099,995 2,000,000 288,824 146,585 10,001,836 2021 875,000 0 8,378,012 602,492 1,225,000 250,351 113,323 11,444,178
President and Chief Executive Officer of FPL 2023 896,154 0 6,274,511 1,199,997 1,840,000 117,429 235,316 10,563,407
Executive Vice President, Chief
Legal, Environmental and
Federal Regulatory Affairs
Officer of NextEra Energy and
Executive Vice President of FPL 2023 1,274,300 0 2,665,736 509,894 1,641,300 423,332 207,615 6,772,178 2022 1,190,900 0 2,376,928 476,495 1,429,080 380,269 174,889 6,028,560 2021 1,082,600 0 7,428,609 433,198 1,299,100 357,356 161,282 10,762,145
| | DESCRIPTION | | | MARKET | | | VOLATILITY | | | YIELD | | | INTEREST RATE | | | EXPECTED LIFE | | | FAIR VALUE | | ||||||||||||||||||
| | For the 2/16/2023 grant | | | | $ | 75.69 | | | | | | 27.17% | | | | | | 2.45% | | | | | | 4.34% | | | | | | 2.87yr. | | | | | $ | 70.42 | | |
| | For the 2/17/2022 grant | | | | $ | 75.38 | | | | | | 29.85% | | | | | | 2.42% | | | | | | 1.67% | | | | | | 2.87 yr. | | | | | $ | 66.39 | | |
| | For the 2/11/2021 grant | | | | $ | 83.95 | | | | | | 27.91% | | | | | | 2.30% | | | | | | 0.18% | | | | | | 2.88 yr. | | | | | $ | 86.50 | | |
Name and Principal Position(a)(1) | Year (b) | Salary ($)(c) | Bonus ($)(d) | Stock Awards(3)(4)(5) ($)(e) | Option Awards(3) ($)(f) | Non-Equity Incentive Plan Compen- sation(6) ($)(g) | Change in Value and (7)(8) ($)(h) | All Other Compen- sation(7)(9) ($)(i) | Total ($)(j) | ||||||||||||||||||||||||||||||||||||
James L. Robo |
|
2021 |
|
|
$1,560,000 |
|
|
$0 |
|
|
$14,166,104 |
|
|
$3,225,000 |
|
|
$4,992,000 |
|
|
$1,023,668 |
|
|
$369,164 |
|
|
$25,335,936 |
| ||||||||||||||||||
Chairman, President and CEO | 2020 | 1,500,000 | 0 | 13,076,826 | 3,024,983 | 4,800,000 | 951,970 | 366,928 | 23,720,707 | ||||||||||||||||||||||||||||||||||||
| 2019 | 1,450,000 | 0 | 11,744,534 | 2,825,000 | 4,570,400 | 906,719 | 380,944 | 21,877,597 | |||||||||||||||||||||||||||||||||||||
Rebecca J. Kujawa | 2021 | 875,000 | 0 | 8,378,012 | 602,492 | 1,225,000 | 250,351 | 113,323 | 11,444,178 | ||||||||||||||||||||||||||||||||||||
Executive Vice President,
| 2020 | 687,700 | 0 | 2,015,368 | 364,783 | 962,800 | 180,723 | 93,332 | 4,304,706 | ||||||||||||||||||||||||||||||||||||
| 2019 | 529,000 | 0 | 1,496,724 | 280,600 | 729,500 | 110,820 | 66,153 | 3,212,797 | |||||||||||||||||||||||||||||||||||||
John W. Ketchum | 2021 | 1,400,000 | 0 | 10,517,014 | 983,999 | 1,960,000 | 421,019 | 225,121 | 15,507,153 | ||||||||||||||||||||||||||||||||||||
President and CEO of NextEra | 2020 | 1,180,600 | 0 | 3,528,702 | 638,576 | 1,652,800 | 342,563 | 175,541 | 7,518,782 | ||||||||||||||||||||||||||||||||||||
| 2019 | 983,800 | 0 | 2,839,220 | 532,200 | 1,356,700 | 278,554 | 160,341 | 6,150,815 | |||||||||||||||||||||||||||||||||||||
Eric E. Silagy | 2021 | 1,400,000 | 0 | 10,517,092 | 983,999 | 1,960,000 | 472,129 | 220,744 | 15,553,964 | ||||||||||||||||||||||||||||||||||||
President and CEO of FPL | 2020 | 1,304,100 | 0 | 4,293,948 | 777,091 | 1,825,700 | 413,289 | 187,776 | 8,801,904 | ||||||||||||||||||||||||||||||||||||
|
| 2019
|
|
| 1,154,100
|
|
| 0
|
| 3,668,772 | 687,700 | 1,591,500 | 368,555 | 175,873 | 7,646,500 | |||||||||||||||||||||||||||||||
Charles E. Sieving | 2021 | 1,082,600 | 0 | 7,428,609 | 433,198 | 1,299,100 | 357,356 | 161,282 | 10,762,145 | ||||||||||||||||||||||||||||||||||||
Executive Vice President and | 2020 | 1,082,600 | 0 | 2,001,924 | 362,285 | 1,266,600 | 330,644 | 150,315 | 5,194,368 | ||||||||||||||||||||||||||||||||||||
| 2019 | 1,002,400 | 0 | 1,789,598 | 335,500 | 1,172,800 | 295,814 | 138,999 | 4,735,111 | |||||||||||||||||||||||||||||||||||||
|
|
67
|
|
|
| Description | Market | Volatility | Yield | Interest Rate | Expected Life | Fair Value | ||||||||||||||||||||||||
For the 2/11/2021 grant: | $ | 83.95 | 27.91 | % | 2.30 | % | 0.18 | % | 2.88 yr. | $86.50 | ||||||||||||||||||||
For the 2/13/2020 grant: | $ | 68.8675 | 14.48 | % | 2.50 | % | 1.42 | % | 2.88 yr. | $69.345 | ||||||||||||||||||||
For the 2/14/2019 grant: | $ | 45.65 | 15.76 | % | 2.93 | % | 2.47 | % | 2.88 yr. | $42.95 | ||||||||||||||||||||
|
|
|
|
|
The following table (Table 1b) provides additional information for 20212023 regarding column (i)(J) of Table 1a: 20212023 Summary Compensation Table.
| | NAME | | | TOTAL FROM SUMMARY COMPENSATION TABLE ($) | | | CONTRIBUTIONS TO DEFINED CONTRIBUTION PLANS(1) ($) | | | PERQUISITES AND OTHER PERSONAL BENEFITS(2) ($) | | |||||||||
| | John W. Ketchum | | | | | 399,396 | | | | | | 288,425 | | | | | | 110,971 | | |
| | Terrell Kirk Crews II | | | | | 103,552 | | | | | | 76,743 | | | | | | 26,809 | | |
| | Rebecca J. Kujawa | | | | | 173,876 | | | | | | 147,067 | | | | | | 26,809 | | |
| | Armando Pimentel, Jr. | | | | | 235,316 | | | | | | 40,155 | | | | | | 195,160 | | |
| | Charles E. Sieving | | | | | 207,615 | | | | | | 128,258 | | | | | | 79,357 | | |
| Name | Total From ($) | Contributions ($) | Perquisites and Other Personal Benefits(2) ($) | ||||||||||||
James L. Robo | $369,164 | $302,001 | $67,163 | ||||||||||||
Rebecca J. Kujawa | 113,323 | 86,988 | 26,335 | ||||||||||||
John W. Ketchum | 225,121 | 144,647 | 80,474 | ||||||||||||
Eric E. Silagy | 220,744 | 153,063 | 67,681 | ||||||||||||
Charles E. Sieving | 161,282 | 111,587 | 49,695 | ||||||||||||
|
68
|
plan-based awards
69
| | (A) | | | (B) | | | (C) | | | (D) | | | (E) | | | (F) | | | (G) | | | (H) | | | (I) | | | (J) | | | (K) | | | (L) | | |||||||||||||||||||||||||||||||||
| | NAME | | | GRANT DATE | | | ESTIMATED FUTURE PAYOUTS UNDER NON-EQUITY INCENTIVE PLAN AWARDS(1) | | | ESTIMATED FUTURE PAYOUTS UNDER EQUITY INCENTIVE PLAN AWARDS(2) | | | ALL OTHER STOCK AWARDS: NUMBER OF SHARES OF STOCK OR UNITS (#) | | | ALL OTHER OPTION AWARDS: NUMBER OF SECURITIES UNDERLYING OPTIONS(3) (#) | | | EXERCISE OR BASE PRICE OF OPTION AWARDS ($/SH) | | | Grant Date Fair Value of Stock and Option Awards(4) ($) | | |||||||||||||||||||||||||||||||||||||||||||||
| | THRESHOLD ($) | | | TARGET ($) | | | MAXIMUM ($) | | | THRESHOLD (#) | | | TARGET (#) | | | MAXIMUM (#) | | |||||||||||||||||||||||||||||||||||||||||||||||||||
| | John W. Ketchum | | | | | — | | | | | | 0 | | | | | | 2,520,000 | | | | | | 5,040,000 | | | | | | — | | | | | | — | | | | | | — | | | | | | — | | | | | | — | | | | | | — | | | | | | — | | |
| | | | 2/16/2023 | | | | | | | | | | | | | | | | | | | | | | | | 0 | | | | | | 96,654 | | | | | | 193,308 | | | | | | | | | | | | | | | | | | | | | | | | 9,528,925 | | | |||
| | | | 2/16/2023 | | | | | | | | | | | | | | | | | | | | | | | | 0 | | | | | | 4,122 | | | | | | 4,122 | | | | | | | | | | | | | | | | | | | | | | | | 311,994 | | | |||
| | | | 2/16/2023 | | | | | | | | | | | | | | | | | | | | | | | | | | | | | | | | | | | | | | | | | | | | | | | | 172,757 | | | | | | 75.69 | | | | | | 2,599,993 | | | |||
| | | | 2/22/2023 | | | | | | | | | | | | | | | | | | | | | | | | 0 | | | | | | 10,546 | | | | | | 10,546 | | | | | | | | | | | | | | | | | | | | | | | | 727,990 | | | |||
| | Terrell Kirk Crews II | | | | | — | | | | | | 0 | | | | | | 511,200 | | | | | | 1,022,400 | | | | | | — | | | | | | — | | | | | | — | | | | | | — | | | | | | — | | | | | | — | | | | | | — | | |
| | | | 2/16/2023 | | | | | | | | | | | | | | | | | | | | | | | | 0 | | | | | | 16,802 | | | | | | 33,604 | | | | | | | | | | | | | | | | | | | | | | | | 1,656,476 | | | |||
| | | | 2/16/2023 | | | | | | | | | | | | | | | | | | | | | | | | 0 | | | | | | 3,363 | | | | | | 3,363 | | | | | | | | | | | | | | | | | | | | | | | | 254,545 | | | |||
| | | | 2/16/2023 | | | | | | | | | | | | | | | | | | | | | | | | | | | | | | | | | | | | | | | | | | | | | | | | 26,026 | | | | | | 75.69 | | | | | | 391,691 | | | |||
| | | | 2/22/2023 | | | | | | | | | | | | | | | | | | | | | | | | 0 | | | | | | 1,986 | | | | | | 1,986 | | | | | | | | | | | | | | | | | | | | | | | | 137,094 | | | |||
| | Rebecca J. Kujawa | | | | | — | | | | | | 0 | | | | | | 1,100,000 | | | | | | 2,200,000 | | | | | | — | | | | | | — | | | | | | — | | | | | | — | | | | | | — | | | | | | — | | | | | | — | | |
| | | | 2/16/2023 | | | | | | | | | | | | | | | | | | | | | | | | 0 | | | | | | 58,335 | | | | | | 116,670 | | | | | | | | | | | | | | | | | | | | | | | | 5,751,131 | | | |||
| | | | 2/16/2023 | | | | | | | | | | | | | | | | | | | | | | | | 0 | | | | | | 11,679 | | | | | | 11,679 | | | | | | | | | | | | | | | | | | | | | | | | 883,984 | | | |||
| | | | 2/16/2023 | | | | | | | | | | | | | | | | | | | | | | | | | | | | | | | | | | | | | | | | | | | | | | | | 90,365 | | | | | | 75.69 | | | | | | 1,359,993 | | | |||
| | | | 2/22/2023 | | | | | | | | | | | | | | | | | | | | | | | | 0 | | | | | | 6,895 | | | | | | 6,895 | | | | | | | | | | | | | | | | | | | | | | | | 475,962 | | | |||
| | Armando Pimentel, Jr. | | | | | — | | | | | | 0 | | | | | | 1,000,000 | | | | | | 2,000,000 | | | | | | — | | | | | | — | | | | | | — | | | | | | — | | | | | | — | | | | | | — | | | | | | — | | |
| | | | 2/16/2023 | | | | | | | | | | | | | | | | | | | | | | | | 0 | | | | | | 51,472 | | | | | | 102,944 | | | | | | | | | | | | | | | | | | | | | | | | 5,074,522 | | | |||
| | | | 2/16/2023 | | | | | | | | | | | | | | | | | | | | | | | | 0 | | | | | | 15,854 | | | | | | 15,854 | | | | | | | | | | | | | | | | | | | | | | | | 1,199,989 | | | |||
| | | | 2/16/2023 | | | | | | | | | | | | | | | | | | | | | | | | | | | | | | | | | | | | | | | | | | | | | | | | 79,734 | | | | | | 75.69 | | | | | | 1,199,997 | | | |||
| | Charles E. Sieving | | | | | — | | | | | | 0 | | | | | | 892,000 | | | | | | 1,784,000 | | | | | | — | | | | | | — | | | | | | — | | | | | | — | | | | | | — | | | | | | — | | | | | | — | | |
| | | | 2/16/2023 | | | | | | | | | | | | | | | | | | | | | | | | 0 | | | | | | 21,868 | | | | | | 43,736 | | | | | | | | | | | | | | | | | | | | | | | | 2,155,922 | | | |||
| | | | 2/16/2023 | | | | | | | | | | | | | | | | | | | | | | | | 0 | | | | | | 4,378 | | | | | | 4,378 | | | | | | | | | | | | | | | | | | | | | | | | 331,371 | | | |||
| | | | 2/16/2023 | | | | | | | | | | | | | | | | | | | | | | | | | | | | | | | | | | | | | | | | | | | | | | | | 33,880 | | | | | | 75.69 | | | | | | 509,894 | | | |||
| | | | 2/22/2023 | | | | | | | | | | | | | | | | | | | | | | | | | | | | | | 2,585 | | | | | | 2,585 | | | | | | | | | | | | | | | | | | | | | | | | 178,443 | | | |||
| Name(a) | Grant Date (b) | Estimated Future Payouts Under Non-Equity Incentive Plan Awards(1) | Estimated Future Payouts Under Equity Incentive Plan Awards(2) | All Other (#) (i) | All Other Option Awards: Number of Securities Underlying Options(3) (#) (j) | Exercise Base Price (k) | Grant Date Fair Value of Stock (l) | ||||||||||||||||||||||||||||||||||||||||||||||||
Thre- (c) | Target ($) (d) | Maximum ($) (e) | Thre- (#) (f) | Target (#) (g) | Maximum (#) (h) | ||||||||||||||||||||||||||||||||||||||||||||||||||
James L. Robo |
| — | $ | 0 | $ | 2,496,000 | $ | 4,992,000 |
| — |
| — |
| — |
| — |
| — |
| — |
| — |
| ||||||||||||||||||||||||||||||||
| 2/11/2021 |
| 0 |
| 106,327 |
| 212,654 | $ | 12,876,200 |
| |||||||||||||||||||||||||||||||||||||||||||||
| 2/11/2021 |
| 0 |
| 4,609 |
| 4,609 |
| 386,926 |
| |||||||||||||||||||||||||||||||||||||||||||||
| — |
| — |
| — |
| — |
| — |
| |||||||||||||||||||||||||||||||||||||||||||||
| 2/11/2021 |
| 326,417 | $ | 83.95 |
| 3,225,000 |
| |||||||||||||||||||||||||||||||||||||||||||||||
| 2/16/2021 |
| 0 |
| 11,283 |
| 11,283 |
| 902,978 |
| |||||||||||||||||||||||||||||||||||||||||||||
Rebecca J. Kujawa |
| — |
| 0 |
| 612,500 |
| 1,225,000 |
| — |
| — |
| — |
| — |
| — |
| — |
| — |
| ||||||||||||||||||||||||||||||||
| 2/11/2021 |
| 0 |
| 22,920 |
| 45,840 |
| 2,775,612 |
| |||||||||||||||||||||||||||||||||||||||||||||
| 2/11/2021 |
| 0 |
| 4,664 |
| 4,664 |
| 391,543 |
| |||||||||||||||||||||||||||||||||||||||||||||
| 2/11/2021 |
| 0 |
| 59,559 |
| 59,559 |
| 4,999,978 |
| |||||||||||||||||||||||||||||||||||||||||||||
| 2/11/2021 |
| 60,981 |
| 83.95 |
| 602,492 |
| |||||||||||||||||||||||||||||||||||||||||||||||
| 2/16/2021 |
| 0 |
| 2,635 |
| 2,635 |
| 210,879 |
| |||||||||||||||||||||||||||||||||||||||||||||
John W. Ketchum |
| — |
| 0 |
| 980,000 |
| 1,960,000 |
| — |
| — |
| — |
| — |
| — |
| — |
| — |
| ||||||||||||||||||||||||||||||||
| 2/11/2021 |
| 0 |
| 37,433 |
| 74,866 |
| 4,533,136 |
| |||||||||||||||||||||||||||||||||||||||||||||
| 2/11/2021 |
| 0 |
| 7,618 |
| 7,618 |
| 639,531 |
| |||||||||||||||||||||||||||||||||||||||||||||
| 2/11/2021 |
| 0 |
| 59,559 |
| 59,559 |
| 4,999,978 |
| |||||||||||||||||||||||||||||||||||||||||||||
| 2/11/2021 |
| 99,595 |
| 83.95 |
| 983,999 |
| |||||||||||||||||||||||||||||||||||||||||||||||
| 2/16/2021 |
| 0 |
| 4,303 |
| 4,303 |
| 344,369 |
| |||||||||||||||||||||||||||||||||||||||||||||
Eric E. Silagy |
| — |
| 0 |
| 980,000 |
| 1,960,000 |
| — |
| — |
| — |
| — |
| — |
| — |
| — |
| ||||||||||||||||||||||||||||||||
| 2/11/2021 |
| 0 |
| 37,433 |
| 74,866 |
| 4,533,136 |
| |||||||||||||||||||||||||||||||||||||||||||||
| 2/11/2021 |
| 0 |
| 11,721 |
| 11,721 |
| 983,978 |
| |||||||||||||||||||||||||||||||||||||||||||||
| 2/11/2021 |
| 0 |
| 59,559 |
| 59,559 |
| 4,999,978 |
| |||||||||||||||||||||||||||||||||||||||||||||
| 2/11/2021 |
| 99,595 |
| 83.95 |
| 983,999 |
| |||||||||||||||||||||||||||||||||||||||||||||||
Charles E. Sieving |
| — |
| 0 |
| 649,560 |
| 1,299,120 |
| — |
| — |
| — |
| — |
| — |
| — |
| — |
| ||||||||||||||||||||||||||||||||
| 2/11/2021 |
| 0 |
| 16,478 |
| 32,956 |
| 1,995,486 |
| |||||||||||||||||||||||||||||||||||||||||||||
| 2/11/2021 |
| 0 |
| 3,354 |
| 3,354 |
| 281,568 |
| |||||||||||||||||||||||||||||||||||||||||||||
| 2/11/2021 |
| 0 |
| 59,559 |
| 59,559 |
| 4,999,978 |
| |||||||||||||||||||||||||||||||||||||||||||||
| 2/11/2021 |
| 43,846 |
| 83.95 |
| 433,198 |
| |||||||||||||||||||||||||||||||||||||||||||||||
| 2/16/2021 |
| 0 |
| 1,894 |
| 1,894 |
| 151,577 |
| |||||||||||||||||||||||||||||||||||||||||||||
|
|
|
|
70
Additional Disclosure Related to 20211a: 2023 Summary Compensation Table and 2021 Grants of Plan-Based Awards Table
Material Terms of Performance Shares Granted for actual amounts paid with respect to 2023 under the Annual Incentive Plan. No discretionary bonuses were paid to NEOs in 2023.
Material Terms of Performance-Based Restricted Stock Granted to NEOs in 2021
MATERIAL TERMS OF PERFORMANCE-BASED RESTRICTED STOCK GRANTED TO NEOS IN 2023
Material Terms of Performance-Based RestrictedCommon Units Granted to NEOs in 2021COMMON UNITS GRANTED TO NEOS IN 2023
71
»
»
Material Terms of Stock Options Granted to NEOs in 2021
Executive Retention Material Terms of Performance-Based Restricted Stock Units Granted to NEOs as Executive Transition Awards in 2021
if corporate performance objective of adjusted earnings of $2.2 billion is met as of the end of each year within the vesting period, performance-based restricted stock units vest in accordance with the vesting schedule applicable to each NEO as described in the Compensation Discussion & Analysis.
if corporate performance objective of adjusted earnings of $2.2 billion is not met in any year ending within a vesting period, performance-based restricted stock units scheduled to vest in that vesting period are forfeited;
dividends are reinvested as additional performance-based restricted stock units as and when declared by the Company, but are subject to forfeiture if awards are forfeited prior to vesting;
NEOs do not have the right to vote their shares of performance-based restricted stock units;
may vest in full or in part prior to or on normal vesting date and, in some circumstances, without regard to satisfaction of performance objective, upon the occurrence of certain events, such as change in control, followed by a qualified termination, death, or disability (none of the units vest upon retirement);
forfeited if employment terminates prior to vesting in all other instances; and
award agreement includes non-solicitation and non-competition provisions.
Determination of Amount Payable Under Annual Incentive Plan to NEOs
See Compensation Discussion & Analysis for a description of the criteria used to determine the amount payable to each NEO under the Annual Incentive Plan (Non-Equity(Non-Equity Incentive Plan Compensation).
72
Table 3: 2021 Outstanding Equity Awards2023 outstanding equity awards at Fiscal Year End
fiscal year end
73
![[MISSING IMAGE: pc_comp-pn.jpg]](https://capedge.com/proxy/DEF 14A/0001104659-24-041966/pc_comp-pn.jpg)
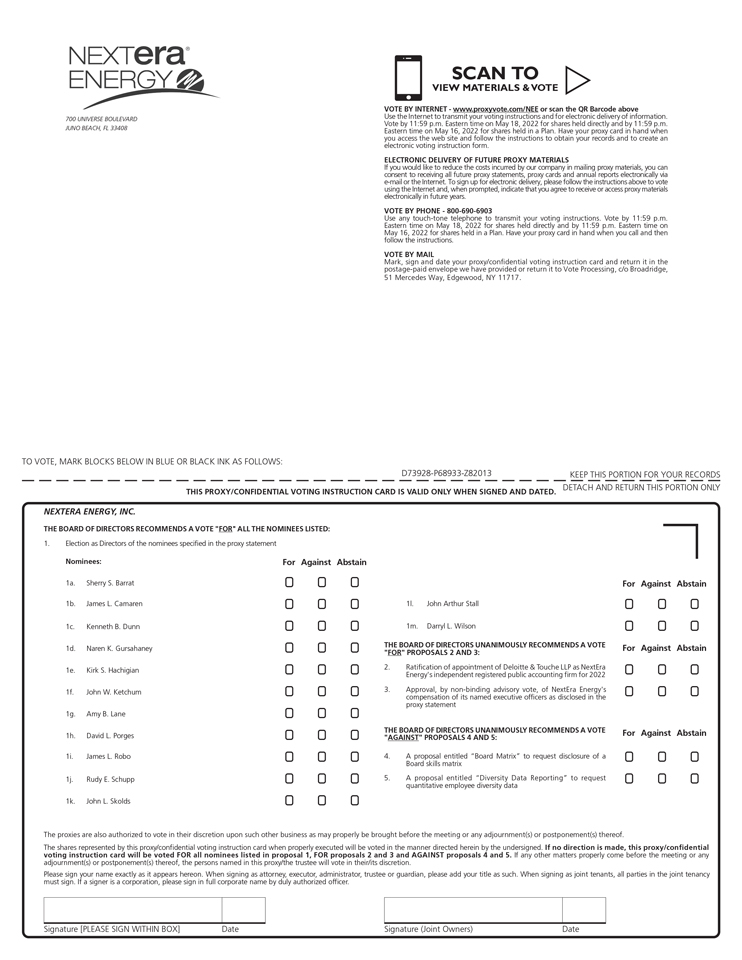
![[MISSING IMAGE: lg_fsc-vertical2.jpg]](https://capedge.com/proxy/DEF 14A/0001104659-24-041966/lg_fsc-vertical2.jpg)
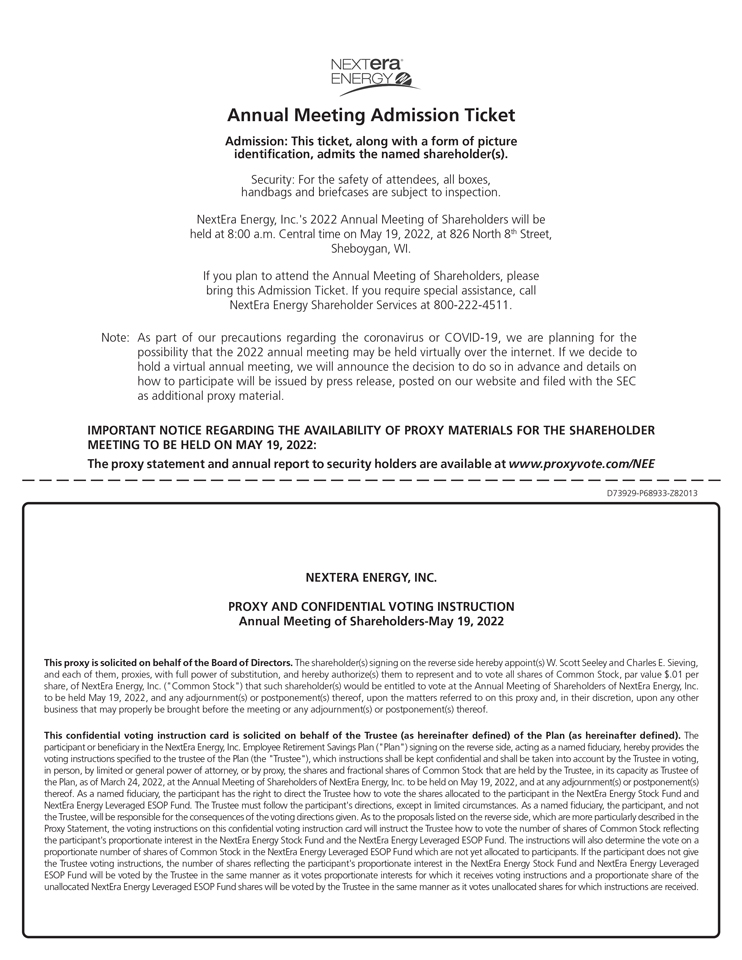
![[MISSING IMAGE: px_24nexterapage01-bw.jpg]](https://capedge.com/proxy/DEF 14A/0001104659-24-041966/px_24nexterapage01-bw.jpg)
![[MISSING IMAGE: px_24nexterapage02-bw.jpg]](https://capedge.com/proxy/DEF 14A/0001104659-24-041966/px_24nexterapage02-bw.jpg)